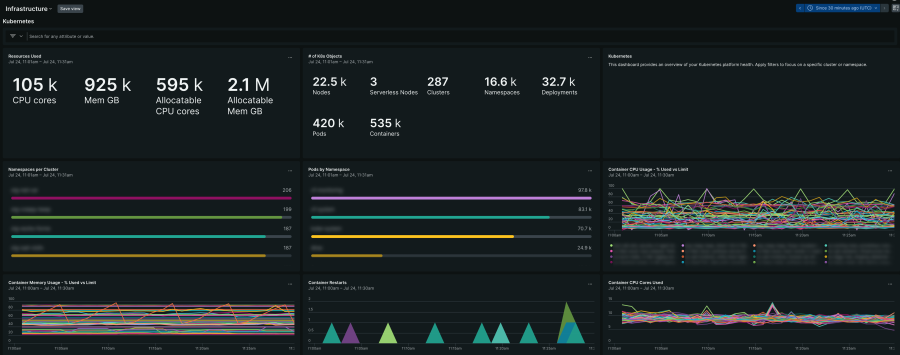
The Container Fabric Team, responsible for providing a self-service Kubernetes platform for internal engineering teams, also uses New Relic to monitor and optimize an expansive multi-cloud environment. With an impressive scale of hundreds of Kubernetes clusters and tens of thousands of nodes across major public cloud providers, the team relies on New Relic for end-to-end visibility, proactive problem-solving, cost optimization, and fostering cross-team collaboration The Container Fabric Team also uses New Relic for observability needs, integrating it deeply into their Kubernetes and multi-cloud operations.
New Relic Functionalities Utilized
- Infrastructure Agent: Deployed across all Kubernetes nodes to collect host-level and container-level metrics.
- Custom Instrumentation: Extensively used to expose specific metrics from Kubernetes controllers, automation, CoreDNS, and even Linux OS details for deep insights.
- Cloud Integrations: Used to pull metrics from major public cloud providers APIs, providing a holistic view of cloud provider services alongside internal telemetry.
- Dashboards and Query Builder: Critical for visualizing platform health, performance trends, and for ad-hoc data exploration during incident investigations.
- Alerting: Proactive alerts based on key platform health indicators.
- Centralized Data Platform: New Relic provides a shared data context that breaks down silos between the container fabric team and application and developer teams they support.
The team focuses on platform-level health and efficiency and is using the following key performance indicators (KPIs):
- Kubernetes Health
- Number of unscheduled pods
- Issues related to worker node scaling
- Pod states (for example,“CrashLoopBackOff”)
- Kubernetes API server, Scheduler, and CoreDNS metrics

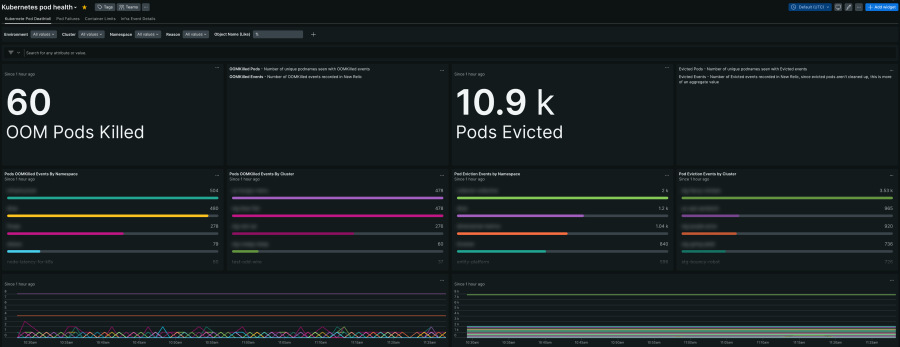
Kubernetes Pod Health
- Resource Utilization and Cost Optimization
- Significant CPU usage on workers
- Idle CPU and memory for nodes (to improve bin packing and reduce waste)

- Cloud Infrastructure
- Virtual machine (VM) instance metrics (CPU, memory, disk I/O, network)
- Kafka broker metrics (for example, replication factor, networking drops)
- Monitoring of underlying cloud provider services and their performance
Below are some of the results that the Container Fabric Team achieves using New Relic:
- Enhanced Availability and Reliability
- Proactive Problem Solving: By continuously observing the platform, the team can identify and address potential issues before they impact customers.
- Faster Incident Investigation and Resolution: New Relic dashboards, custom instrumentation, and the ability to correlate data across various layers—from application and services to Kubernetes layers (pods, nodes) to underlying cloud infrastructure—significantly reduce mean time to resolution (MTTR). For instance, when the browser team reported an issue with the frontend, the Container Fabric Team tied it to unscheduled pods, and quickly traced the issue to an Istio control plane alert before resolving it by scaling Istio pods.
- Identifying External Dependencies: The detailed telemetry allowed the team to pinpoint a networking issue on a cloud provider's storage servers as the root cause of certain performance spikes, even when initial investigations pointed elsewhere. This deep visibility into third-party cloud services is crucial for maintaining platform reliability.
- Significant Cost Optimization
- Data-Driven Instance Selection: Through performance benchmarking using New Relic data, the team can compare the cost-effectiveness and performance of different instance types and cloud providers. This enables them to select the most financially optimal infrastructure for their workloads.
- Improved Resource Utilization: By monitoring idle CPU and memory, the team can proactively identify opportunities to improve "bin packing" of services on nodes, leading to better resource utilization and reduced cloud expenditure. This also allows them to force scaling down of underutilized nodes.
- Smooth Cross-Team Collaboration
- Shared Observability Context: New Relic acts as a common language and data source across internal teams. Sharing dashboards and NRQL queries facilitates quick context sharing and reduces friction during incident troubleshooting, allowing teams to collaborate effectively to pinpoint and resolve issues.
- Bidirectional Knowledge Transfer: The shared data and the process of joint investigation makes it easier for teams to learn about other teams’ workloads and functions, leading to improved overall engineering practices.
Empowered Self-Service for Internal Customers
The Container Fabric Team provides internal developer teams with the tools and data within New Relic to monitor their own services at the application level. While the platform team focuses on infrastructure health, application teams are empowered to self-serve their observability needs, reducing reliance on the platform team for day-to-day monitoring of their services.
Informed Strategic Decision Making
Beyond incident resolution, New Relic provides the granular data necessary for long-term strategic decisions, such as expanding cloud footprints, comparing cloud provider offerings, and optimizing their multi-cloud strategy based on real-world performance and cost data.

