To monitor a large number of short-lived containers, Kubernetes has built-in tools and APIs that help you understand the performance of your applications. A monitoring strategy that takes advantage of Kubernetes’ built-in monitoring tools will give you a bird's eye view of your entire application’s performance, even if containers running your applications are continuously moving between hosts or being scaled up and down.
Here are some best practices to consider if you incorporate Kubernetes environments into your infrastructure.
Part one of a multi-part series on monitoring Kubernetes for total infrastructure observability
In this blog post, you'll learn how to monitor Kubernetes and what components you’ll need for complete observability. We’ll describe in detail what Kubernetes can do along with best-practices for leveraging Kubernetes for a more effective monitoring strategy. It's the first part in a Monitoring Kubernetes series.
What is Kubernetes monitoring?
Kubernetes monitoring helps collect and analyze data to optimize performance, resources, and quickly diagnose problems within Kubernetes clusters. These clusters form the backbone of Kubernetes, and are made up of various machines (nodes) responsible for running containerized applications.
But let’s rewind a little. What is Kubernetes? Kubernetes, often abbreviated as “K8s,” is an open source platform that has established itself as the de facto standard for container orchestration. Usage of Kubernetes has risen globally, particularly in large organizations, with the CNCF in 2021 reporting that there are 5.6 million developers using Kubernetes worldwide, representing 31% of all backend developers.
As a container orchestration system, it automatically schedules, scales, and maintains the containers that make up the infrastructure of any modern application. The project is the flagship project of the Cloud Native Computing Foundation (CNCF). It’s backed by key players like Google, AWS, Microsoft, IBM, Intel, Cisco, and Red Hat.
How to monitor Kubernetes?
Kubernetes automates the mundane operational tasks of managing the containers that make up the necessary software to run an application. With built-in commands for deploying applications, Kubernetes rolls out changes to your applications, scales your applications up, and down to fit changing needs, monitors your applications, and more. Kubernetes orchestrates your containers wherever they run, which facilitates multi-cloud deployments and migrations between infrastructure platforms. In short, Kubernetes makes it easier to manage applications.
Why is monitoring Kubernetes important?
Kubernetes continuously runs health checks against your services. For cloud-native apps, this means consistent container management. Using automated health checks, Kubernetes restarts containers that fail or have stalled.
You can automate mundane sysadmin tasks using Kubernetes since it comes with built-in commands that take care of a lot of the labor-intensive aspects of application management. Kubernetes can ensure that your applications are always running as specified in your configuration.
Kubernetes handles the computer, networking, and storage on behalf of your workloads. This allows developers to focus on applications and not worry about the underlying environment.
Kubernetes monitoring best practices
To monitor a large number of short-lived containers, Kubernetes has built-in tools and APIs that help you understand the performance of your applications. A monitoring strategy that takes advantage of Kubernetes’ built-in monitoring tools will give you a bird's eye view of your entire application’s performance, even if containers running your applications are continuously moving between hosts or being scaled up and down.
Here are some best practices to consider if you incorporate Kubernetes environments into your infrastructure.
- Use namespaces to organize and isolate resources within clusters
- Label and annotate namespaces to easily identify and monitor them
- Set resource requests and limits to prevent overload
- Monitor container health and availability
- Centralize logging and monitoring with tools like Prometheus, Grafana, and others
- Automate deployment
- Conduct regular audits of clusters and containers
- Make sure you are using the most current version of Kubernetes to ensure peak performance and security
How Kubernetes changes your monitoring strategy
If you ever meet someone who tells you, "Kubernetes is easy to understand," most would agree they are lying to you!
Kubernetes requires a new approach to monitoring, especially when you are migrating away from traditional hosts like VMs or on-prem servers.
Containers can live for only a few minutes at a time since they get deployed and re-deployed adjusting to usage demand. How can you troubleshoot if they don't exist anymore?
These containers are also spread out across several hosts on physical servers worldwide. It can be hard to connect a failing process to the affected application without the proper context for the metrics you are collecting.
To monitor a large number of short-lived containers, Kubernetes has built-in tools and APIs that help you understand the performance of your applications. A monitoring strategy that takes advantage of Kubernetes will give you a bird's eye view of your entire application’s performance, even if containers running your applications are continuously moving between hosts or being scaled up and down.
Increased monitoring responsibilities
To get full visibility into your stack, you need to monitor your infrastructure. Modern tech stacks have made the relationship between applications and their infrastructure a more complicated than in the past.
Traditional infrastructure
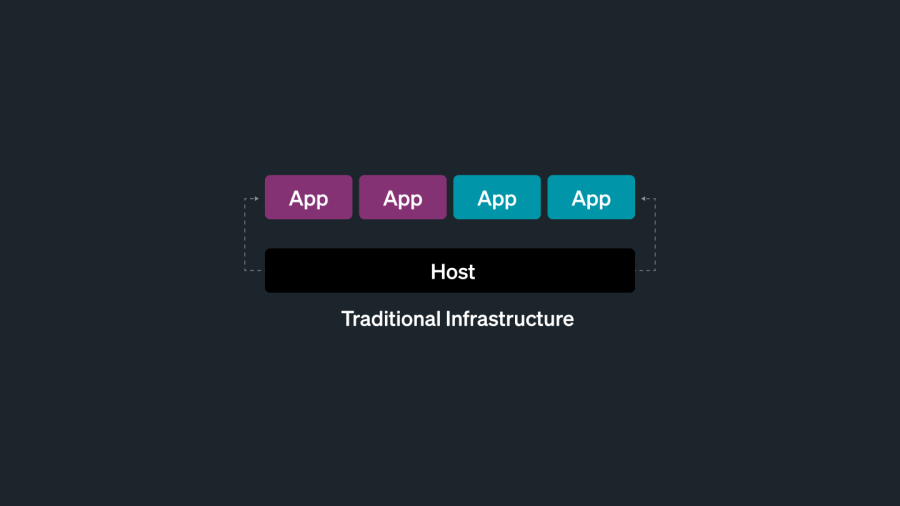
In a traditional infrastructure environment, you only have two things to monitor–your applications and the hosts (servers or VMs) running them.
The introduction of containers
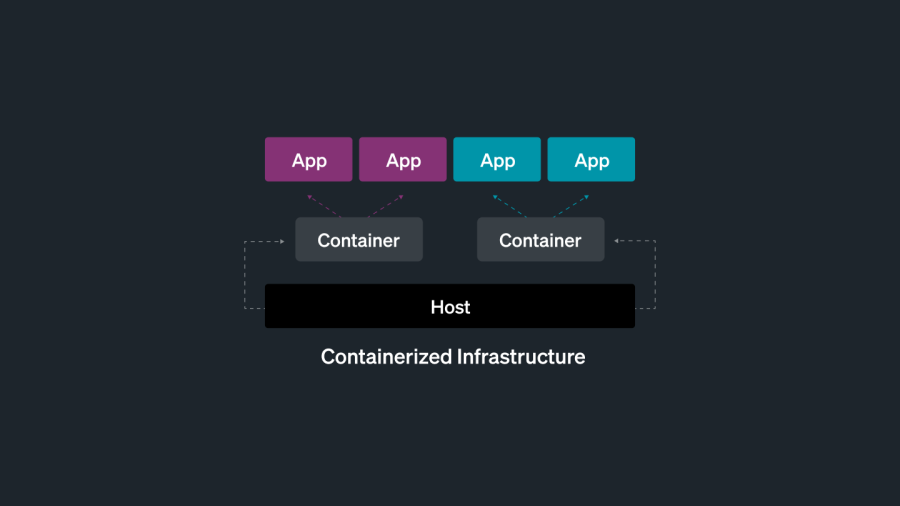
In 2013, Docker introduced containerization to the world. Containers are used to package and run an application, along with its dependencies, in an isolated, predictable, and repeatable way. This adds a layer of abstraction between your infrastructure and your applications. Containers are similar to traditional hosts, in that they run workloads on behalf of the application.
Kubernetes
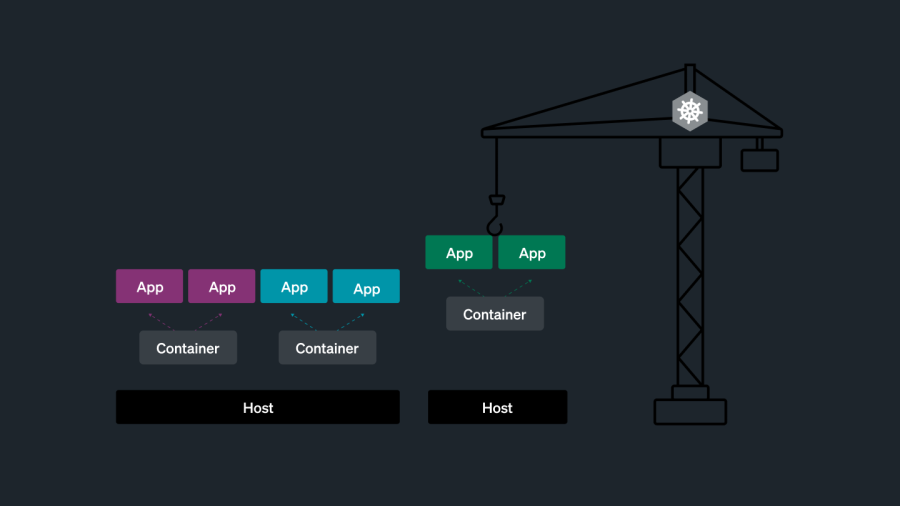
With Kubernetes, full visibility into your stack means collecting telemetry data on the containers that are constantly being automatically spun up and dying while also collecting telemetry data on Kubernetes itself. Gone are the days of checking a few lights on the server sitting in your garage!
There are four distinct components that need to be monitored in a Kubernetes environment each with their specificities and challenges:
- Infrastructure (*worker nodes)
- Containers
- Applications
- Kubernetes clusters (*control plane)
*These concepts will be covered in part two of this guide
Correlating application metrics with infrastructure metrics with metadata
While making it easier to build scalable applications, Kubernetes has blurred the lines between application and infrastructure. If you are a developer, your primary focus is on the application and not the cluster's performance, but the cluster's underlying components can have a direct effect on how well your application performs. For example, a bug in a Kubernetes application might be caused by an issue with the physical infrastructure, but it could also result from a configuration mistake or coding problem.
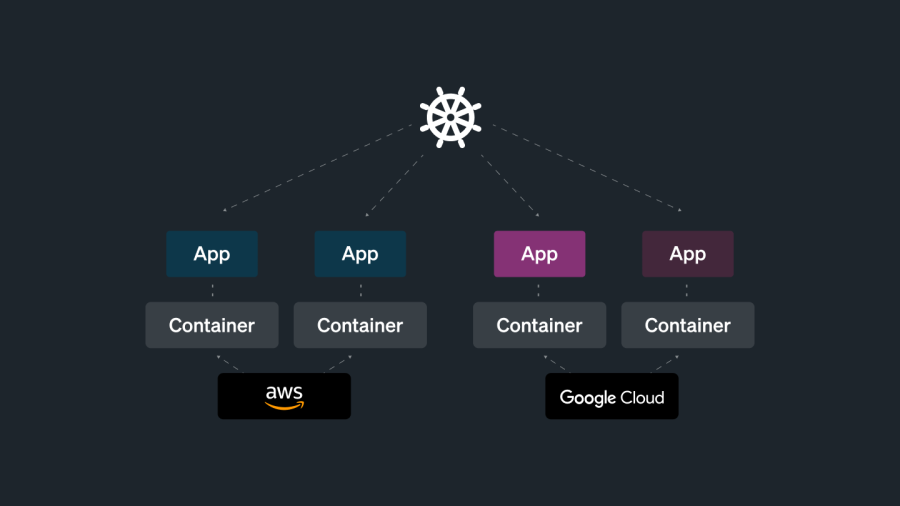
When using Kubernetes, monitoring your application isn’t optional, it’s a necessity!
Most application performance monitoring (APM) language agents don’t care where an application is running. It could be running on an ancient Linux server in a forgotten rack or on the latest Amazon Elastic Compute Cloud (Amazon EC2) instance. Yet when monitoring applications managed by an orchestration layer, having context into infrastructure can be very useful for debugging or troubleshooting. For example, you can relate an application error trace to the container, pod, or host that it’s running on.
Configuring labels in Kubernetes
Kubernetes automates the creation and deletion of containers with varying lifespans. This entire process needs to be monitored. With so many moving pieces, a clear organization-wide labeling policy needs to be in place in order to match metrics to a corresponding application, pod, namespace, node, etc.
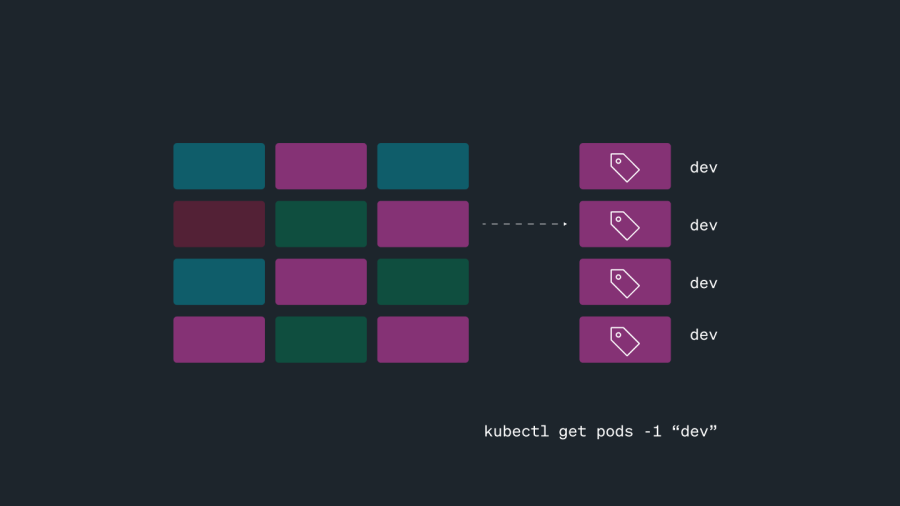
By attaching consistent labels across different objects, you can easily query your Kubernetes cluster for these objects. For example, suppose you get a call from your developers asking if the production environment is down. If the production pods have a “prod” label, you can run the following kubectl command to get all their logs.
kubectl get pods -l name=prod:

NAME  READY STATUS  RESTARTS  AGE

router-worker-6db6999875-b8t8m   0/1   ErrImagePull   0   1d4h

router-worker-6db6999875-7fn7z   1/1   Running        0   47s router-worker-6db6999875-8rl9b   1/1   Running        3   10h router-worker-6db6999875-b8t8m   1/1   Running        2   11h
In this example, you might spot that one of the prod pods has an issue with pulling an image and providing that information to your developers who use the prod pod. If you didn’t have labels, you would have to manually grep the output of kubectl get pods.
Common labeling conventions
In the example above, you saw an instance in which pods are labeled “prod” to identify their use by environment. Every team operated differently but the following naming conventions can commonly be found regardless of the team you work on:
Labels by environment
You can create entities for the environment they belong to. For example:
env: production
env: qa
env: development
env: staging
Labels by team
Creating tags for team names can be helpful to understand which team, group, department, or region was responsible for a change that led to a performance issue.
### Team tags

team: backend
team: frontend0
team: db

### Role tags

roles: architecture
roles: devops
roles: pm

### Region tags

region: emea
region: america
region: asia
Labels by Kubernetes recommended labels
Kubernetes provides a list of recommended labels that allow a baseline grouping of resource objects. The app.kubernetes.io prefix distinguishes between the labels recommended by Kubernetes and the custom labels that you may separately add using a company.com prefix. Some of the most popular recommended Kubernetes labels are listed below.
| Key | Description |
app.kubernetes.io/name | Name of application (such as redis) |
app.kubernetes.io/instance | Unique name for this specific instance of the application (such as redis-department-a) |
app.kubernetes.io/component | A descriptive identifier of what the component is for (such as login-cache) |
app.kubernetes.io/part-of | The higher-level application using this resource (such as company-auth) |
With all of your Kubernetes objects labeled, you can query your observability data to get a bird’s eye view of your infrastructure and applications. You can examine every layer in your stack by filtering your metrics. And, you can drill into more granular details to find the root cause of an issue.
Therefore, having a clear, standardized strategy for creating easy-to-understand labels and selectors should be an important part of your monitoring and alerting strategy for Kubernetes. Ultimately, health and performance metrics can only be aggregated by labels that you set.
Kubernetes monitoring and observability with New Relic
So far, we’ve covered what Kubernetes is, what it can do, why it requires monitoring, and best practices on how to set up proper Kubernetes monitoring.
In part two of this multi-part series, we’ll go through a deep dive into Kubernetes architecture.
Next steps
We also provide a pre-built dashboard and set of alerts for Kubernetes if you're ready to try things out. To use it sign up for a New Relic account today. Your free account includes one user with full access to all of New Relic, 5 basic users who are able to view your reporting, and 100 GB of free data ingest per month.
The views expressed on this blog are those of the author and do not necessarily reflect the views of New Relic. Any solutions offered by the author are environment-specific and not part of the commercial solutions or support offered by New Relic. Please join us exclusively at the Explorers Hub (discuss.newrelic.com) for questions and support related to this blog post. This blog may contain links to content on third-party sites. By providing such links, New Relic does not adopt, guarantee, approve or endorse the information, views or products available on such sites.

