As described in part one of this guide, Kubernetes, often abbreviated as K8s, automates the mundane operational tasks of managing the containers that make up the necessary software to run an application. With built-in commands for deploying applications, Kubernetes rolls out changes to your applications, scales your applications up and down to fit changing needs, monitors your applications, and more. Kubernetes orchestrates your containers wherever they run, which makes it easier to deploy across multiple cloud environments and migrate between infrastructure platforms. In short, Kubernetes makes it easier to manage applications.
A properly configured Kubernetes system saves time and money. But configuring your Kubernetes clusters can be difficult. Improper configuration can lead to problems with application availability, performance, resilience, or overspending. Here in part two of this Kubernetes guide, you'll get help balancing appropriate parameter configuration for any cluster you are working with now or in the future. You'll learn about requests and limits, measuring CPU utilization, and how to optimize Kubernetes resource allocation.
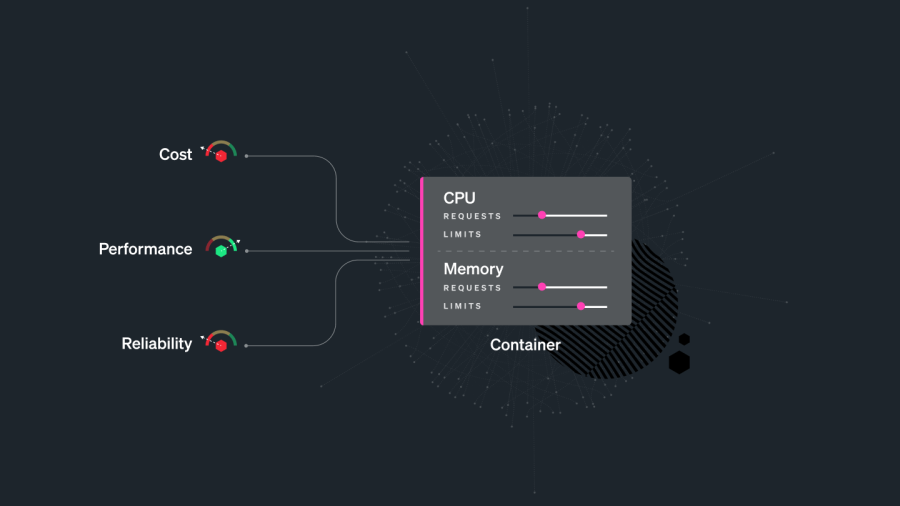
Rightsizing your workloads with requests and limits
In an ideal world, your Kubernetes pods would use exactly the amount of resources you requested. But, in the real world, resource usage isn’t predictable. If you have a large application on a node with limited resources, the node might run out of CPU or memory and things can break. And if you’ve been working as an engineer long enough, you know that things breaking in your architecture means frantic messages in the middle of the night and lost revenue for your organization.
On the flip side, If you allocate too many resources for CPU and memory, then there is waste since those resources remain reserved for that node. When utilization is lower than the requested value, it creates slack cost. When you design and configure a tech stack, the goal is to use the lowest cost resources that still meet the technical specifications of a specific workload.
To rightsize workloads by optimizing the use of resources, it is important to know the historical usage and workload patterns of your system. With this knowledge, you can make informed cost savings decisions. For instance, let’s say your average CPU utilization is only 40% and on your highest traffic day in the last two years the CPU utilization spiked up to only 60%. Your initially provisioned level of compute is too high! A simple change in configuration can result in large savings in cost by reducing underutilized compute resources.
Applying accurate resource requests and limits to deployments can help prevent overprovisioning of extra resources which leads to underutilization and higher cluster costs, or underprovisioning of fewer resources than required, which may lead to various errors such as out of memory (OOM) events.
Kubernetes uses requests and limits to control resources like CPU and memory.
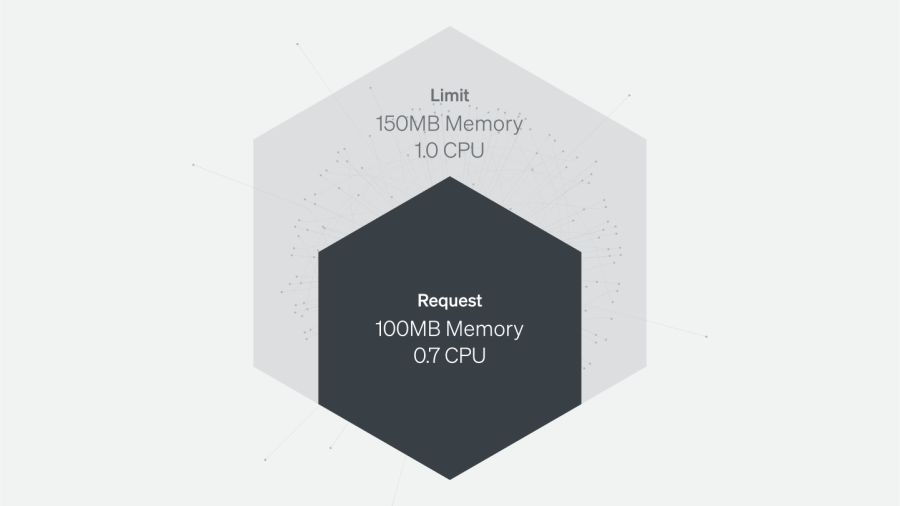
Requests are resources a container is guaranteed to get. If a container requests a resource, the Kubernetes scheduler (kube-scheduler) will ensure the container is placed on a node that can accommodate it.
Limits make sure a container never uses a value that is higher than its quota.
You can set requests and limits per container. Each container in the pod can have its own limit and request, but you can also set the values for limits and requests at the pod or namespace level.
Memory allocation and utilization
Memory resources are defined in bytes. You can express memory as a plain integer or a fixed-point integer with one of these suffixes: E, P, T, G, M, K, Ei, Pi, Ti, Gi, Mi, Ki. For example, the following represent approximately the same value:
128974848, 129e6, 129M, 123Mi
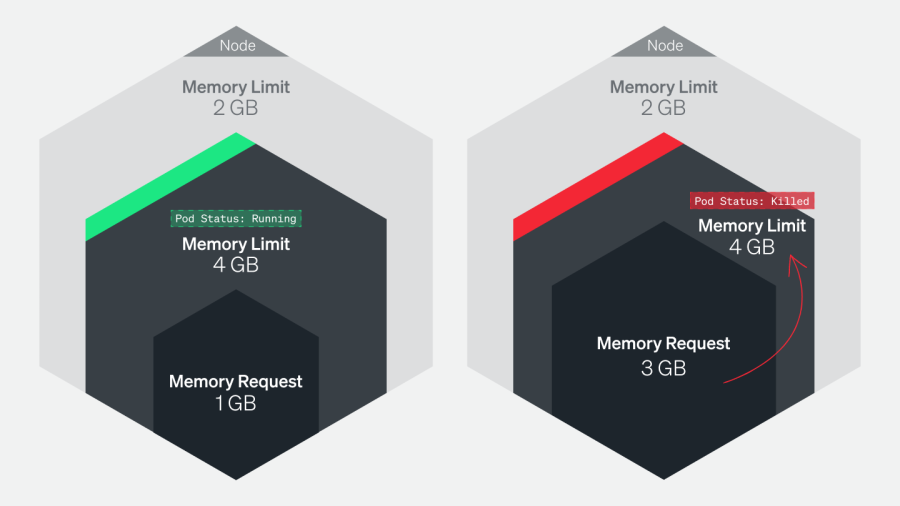
Memory is not a compressible resource and there is no way to throttle memory. If a container goes past its memory limit, it will be killed.
Memory limits and memory utilization per pod
When specified, a memory limit represents the maximum amount of memory a node will allocate to a container. Here are NRQL examples of querying memory limits.
NRQL that targets a New Relic metric:
SELECT latest(cpuUsedCores/cpuLimitCores) FROM K8sContainerSample FACET podName TIMESERIES SINCE 1 day ago NRQL that targets a Prometheus metric:
SELECT rate(sum(container_cpu_usage_seconds_total), 1 SECONDS) FROM Metric SINCE 1 MINUTES AGO UNTIL NOW FACET pod TIMESERIES LIMIT 20If a limit is not provided in the manifest and there is not an overall configured default, a pod could use the entirety of a node’s available memory. A node might be oversubscribed—the sum of the limits for all pods running on a node might be greater than that node’s total allocatable memory. This requires that the pods’ specific requests are below the limit. The node’s kubelet will reduce resource allocation to individual pods if they use more than they request so long as that allocation at least meets their requests.
Tracking pods’ actual memory usage in relation to their specified limits is particularly important because memory is a non-compressible resource. In other words, if a pod uses more memory than its defined limit, the kubelet can’t throttle its memory allocation, so it terminates the processes running on that pod instead. If this happens, the pod will show a status of OOMKilled.
Comparing your pods’ memory usage to their configured limits will alert you to whether they are at risk of being killed because they are out of memory (OOM), as well as whether their limits make sense. If a pod’s limit is too close to its standard memory usage, the pod may get terminated due to an unexpected spike. On the other hand, you may not want to set a pod’s limit significantly higher than its typical usage because that can lead to poor scheduling decisions.
For example, a pod with a memory request of 1gibibyte (GiB) and a limit of 4GiB can be scheduled on a node with 2GiB of allocatable memory (more than sufficient to meet its request). But if the pod suddenly needs 3GiB of memory, it will be killed even though it’s well below its memory limit.
Memory requests and allocatable memory per node
Memory requests are the minimum amounts of memory a node’s kubelet will assign to a container.
If a request is not provided, it will default to whatever the value is for the container’s limit (which, if also not set, could be all memory on the node). Allocatable memory reflects the amount of memory on a node that is available for pods. Specifically, it takes the overall capacity and subtracts memory requirements for OS and Kubernetes system processes to ensure they won’t compete with user pods for resources.
Although node memory capacity is a static value, its allocatable memory (the amount of compute resources that are available for pods) is not. Maintaining an awareness of the sum of pod memory requests on each node, versus each node’s allocatable memory, is important for capacity planning. These metrics will inform you if your nodes have enough capacity to meet the memory requirements of all current pods and if the kube-scheduler is able to assign new pods to nodes. To learn more about the difference between node allocatable memory and node capacity, see Reserve Compute Resources for System Daemons in the Kubernetes documentation.
The kube-scheduler uses several levels of criteria to determine if it can place a pod on a specific node. One of the initial tests is whether a node has enough allocatable memory to satisfy the sum of the requests of all the pods running on that node, plus the new pod. To learn more about the scheduling process criteria, see the node selection section of the Kubernetes scheduler documentation.
Comparing memory requests to capacity metrics can also help you troubleshoot problems when launching and running the number of pods that you want to run across your cluster. If you notice that your cluster’s count of current pods is significantly less than the number of pods you want, these metrics might show you that your nodes don’t have the resource capacity to host new pods. One straightforward remedy for this issue is to provision more nodes for your cluster.
Measuring CPU utilization
One CPU core is equivalent to 1000m (one thousand millicpu or one thousand millicores). If your container needs one full core to run, specify a value of 1000m or just 1. If your container needs 1⁄4 of a core, specify a value of 250m.
CPU is a compressible resource. If your container starts hitting your CPU limits, it will be throttled. CPU will be restricted and performance will degrade. But it won’t be killed.
To get important insight into cluster performance, you’ll need to track two things:
- Track the amount of CPU your pods are using compared to their configured requests and limits.
- Track the CPU utilization at the node level.
Much like a pod exceeding its CPU limits, a lack of available CPU at the node level can lead to the node throttling the amount of CPU allocated to each pod.
Measuring actual utilization compared to requests and limits per pod will help determine if these are configured appropriately and your pods are requesting enough CPU to run properly. Alternatively, consistently higher than expected CPU usage might point to problems with the pod that need to be identified and addressed.
Here's a NRQL query that shows the CPU requests and allocatable CPU per node. Try it on your cluster:
SELECT
filter(sum(`node_namespace_pod_container:container_cpu_usage_seconds_total:sum_irate`), where true) /
filter(sum(kube_pod_container_resource_requests), WHERE (resource = 'cpu') and job = 'kube-state-metrics') * 100 as 'CPU Request Commitment'
FROM Metric FACET node since 1 minute ago
Here’s a NRQL query that shows the CPU requests and allocatable CPU per pod. Try it on your cluster:
SELECT sum(`node_namespace_pod_container:container_cpu_usage_seconds_total:sum_irate`) / filter(sum(kube_pod_container_resource_limits), WHERE (resource = 'cpu') and job = 'kube-state-metrics') * 100 as 'CPU Limit Commitment' FROM Metric FACET pod since 1 minute agoHow to optimize Kubernetes resource allocation
To optimize your resource allocation, you’ll need to define pod specs, resource quotas, and limit range.
Define pod specs
Here is a typical pod spec for resources:
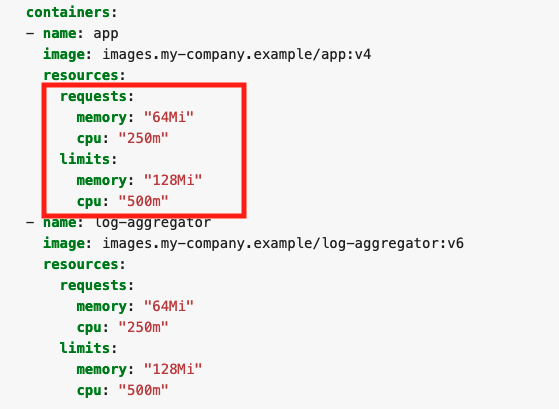
Each container in the pod can set its own requests and limits which are all additive. So in this example, the pod has a total request of 64 mebibyte (MiB) of memory, and a total limit of 128 MiB. Keep in mind that if you put a request for CPU above the core count of your biggest node, your pod will never be scheduled. Unless your application is specifically architected to take advantage of multiple cores, it is generally good to keep your CPU request below 1 and leverage replicas to scale horizontally.
Define resource quotas
Without guardrails, developers can allocate any amount of resources to their applications running on Kubernetes. When several teams share a cluster with a fixed number of nodes, this becomes a problem. Kubernetes allows administrators to set hard limits for resource usage in namespaces with ResourceQuotas.
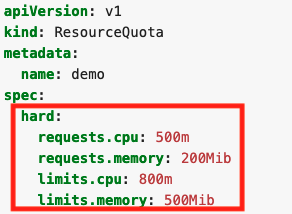
If you apply this file to a namespace, you’ll set the following requirements for all the containers of the namespace:
- The sum of all the CPU requests can’t be higher than 0.5 cores.
- The sum of all the CPU limits can’t be higher than 0.8 cores.
- The sum of all the memory requests can’t be higher than 200 MiB.
- The sum of all the memory limits can’t be higher than 500 MiB.
This means you could have 50 containers with 4 MiB requests, five containers with 40 MiB requests, or even one container with 200 MiB requests.
Define limit range
You can also create a LimitRange for a namespace. Instead of looking at the namespace as a whole, a LimitRange applies to individual containers.
Here’s an example of what a LimitRange might look like:
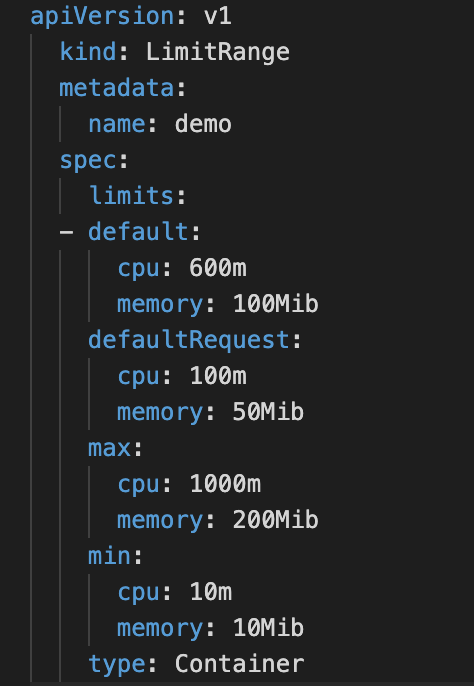
The default section sets the default limits for a container in a pod. If you use the values in the LimitRange, any containers that do set ranges themselves will get assigned the default values.
The defaultRequest section sets the default requests for a container in a pod. If you use the values in the LimitRange, any containers that do set ranges themselves will get assigned the default values.
The max section will set up the maximum limits that a container in a pod can set. The default section and limits set on a container cannot be higher than this value. One thing to note, if the max value is set and the default is not, any containers that do not set these values themselves will get assigned the max value as the limit.
The min section will set up the minimum requests that a container in a pod can set. The defaultRequest section and requests set on a container cannot be lower than this value. One thing to note: if this value is set and the defaultRequest is not, the min value becomes the defaultRequest value.
Conclusion
Now that you’ve learned the basics of Kubernetes and why it needs monitoring in part one and had a deep dive into Kubernetes architecture here in part two, you might want to try out a few things on your own.
A growing number of tools and frameworks are dedicated to helping visualize Kubernetes infrastructure efficiency. Here are two examples:
- Kubecost provides real-time cost visibility and insights for teams using Kubernetes, helping you continuously reduce your cloud costs
- Open Cost is a vendor-neutral open source project for measuring and allocating infrastructure and container costs in real time. (New Relic is a founding contributor.)
Next steps
If you're ready to try monitoring Kubernetes in your own environment, we also provide a pre-built dashboard and set of alerts for Kubernetes. To use it, sign up for a New Relic account today. Your free account includes one user with full access to all of New Relic, unlimited basic users who are able to view your reporting, and 100 GB of data per month.
In part three of this series, you’ll learn how to debug some of the most common Kubernetes errors.
The views expressed on this blog are those of the author and do not necessarily reflect the views of New Relic. Any solutions offered by the author are environment-specific and not part of the commercial solutions or support offered by New Relic. Please join us exclusively at the Explorers Hub (discuss.newrelic.com) for questions and support related to this blog post. This blog may contain links to content on third-party sites. By providing such links, New Relic does not adopt, guarantee, approve or endorse the information, views or products available on such sites.

