Image
Quickstart
A complete Redis monitoring system
Redis operates in-memory and achieves I/O faster than traditional database systems. It includes several data structures which make it ready to use right out of the box.
New Relic provides a Redis quickstart which allows you to monitor your Redis instances out-of-the-box.
New Relic - a perfect tool to monitor Redis
Redis is known for its speed, so ensuring that it stays operating at peak performance is paramount. Slowdowns can lead to a compromised user experience or even a complete application failure.
New Relic's Redis monitor provides actionable insights into the health of a Redis system. It supports custom charts, custom queries, and pre-built dashboards are available for those who don’t need custom configurations. All critical performance and health metrics are monitored.
New Relic Redis quickstart features
Our Redis quickstart include out-of-the-box dashboards and alerts, including data such as:
- Overview Snapshot (# masters, # slaves) + charts with commands/sec and commands/sec by node
- Charts showing connected clients, connected clients by node, changes since last save by node, expired keys/second by node, memory used by node, and blocked clients.
- Charts showing keyspace hit ratio by node, evicted keys/second by node, input bytes/second by node, network I/O per second, and output bytes / second by node.
Value of the Redis quickstart
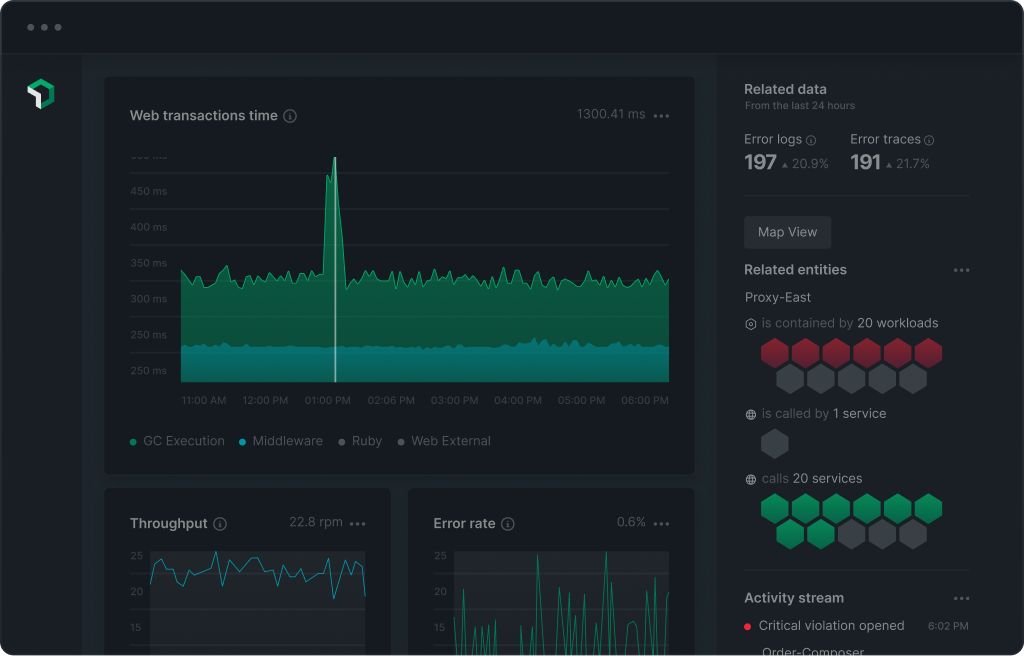
The Redis Quickstart provides a visual snapshot of all the key health information related to your Redis nodes and clusters. Monitoring is made easy via the clear, color-coded dashboard which showcases memory usage, network I/O, node health, and much more.
Authors
Support
BUILT BY NEW RELIC
Need help? Visit our Support Center or check out our community forum, the Explorers Hub.
Need help? Visit our Support Center or check out our community forum, the Explorers Hub.