Quickstart
What is Kohana PHP?
Kohana PHP monitoring provides complete visibility into your applications to detect and resolve performance issues. DevOps teams can automatically instrument the Kohana framework and gain instant value with out-of-the-box dashboards by leveraging New Relic's Kohana PHP monitoring quickstart. Enhance performance monitoring protocols and drive smart business decisions with this approach.
Value of Kohana PHP
Development teams benefit from instant observability with Kohana PHP monitoring. Developers can also take advantage of high-level app summary, monitor user satisfaction, and build architectural maps of the application.
You can quickly find errors and issues by tracking key transactions, monitoring the Kohana dashboard for critical metrics, and alerting your team to errors or problems before they impact users.
New Relic Kohana PHP Quickstart Features
New Relic's Kohana PHP monitoring quickstart offers:
- Alerts (duration, error rate, and throughput)
- Code-level transactions, error traces, and database query traces
- Distributed tracing to see the path taken by requests through a distributed system
- Customizable charts for metric timeslice data and other custom metrics sent to New Relic
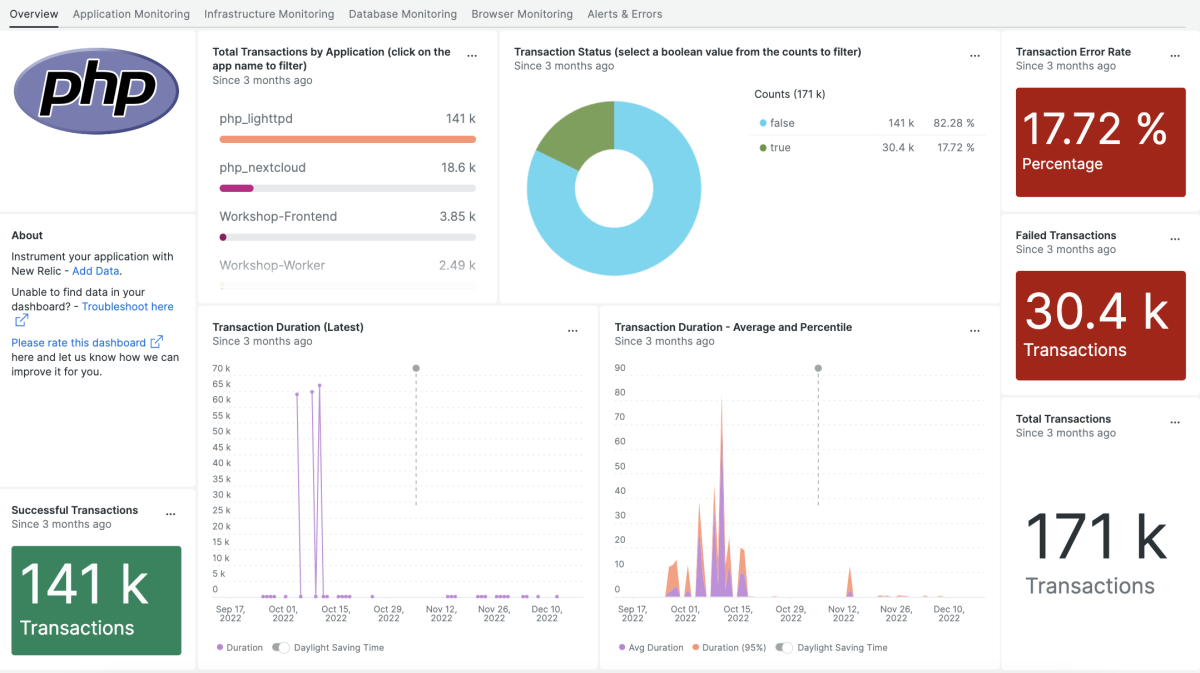
- Kohana dashboards (for transactions overview, errors overview, VM overview, top five slowest transactions, latest error, and more)
When you accelerate troubleshooting with distributed tracing and enhanced visibility into application and data lags in a Kohana dashboard, it's much easier for your team to quickly identify and resolve potential errors and ensure uptime.
The Complete Kohana PHP Dashboard Tool
Help developers optimize the entire infrastructure and help DevOps teams capture discrete events with key-value attributes attached to them, and analyze and query both application and business data.
In addition to the above, New Relic's Kohana PHP quickstart also helps teams organize, query, and visualize data to answer critical questions about app performance and customer experiences.
Connect more than 500 applications to one daemon to impose sampling once you reach the harvest cycle limits. This approach helps reduce complexity and improve efficiency through the instant observability provided by the Kohana dashboard.
Need help? Visit our Support Center or check out our community forum, the Explorers Hub.

