/ 
APM Signals

APM Signals

Comprehensive APM dashboard providing actionable insights, including Throughout, Latency, Error Rate & Apdex.

What's included?

dashboards
1
APM Signals quickstart contains 1 dashboard. These interactive visualizations let you easily explore your data, understand context, and resolve problems faster.
documentation
1
APM Signals observability quickstart contains 1 documentation reference. This is how you'll get your data into New Relic.
alerts
0
This quickstart doesn't include any alerts. Do you think it should?
You can edit this quickstart to add helpful components. View the repository and open a pull request.
View repo View repo

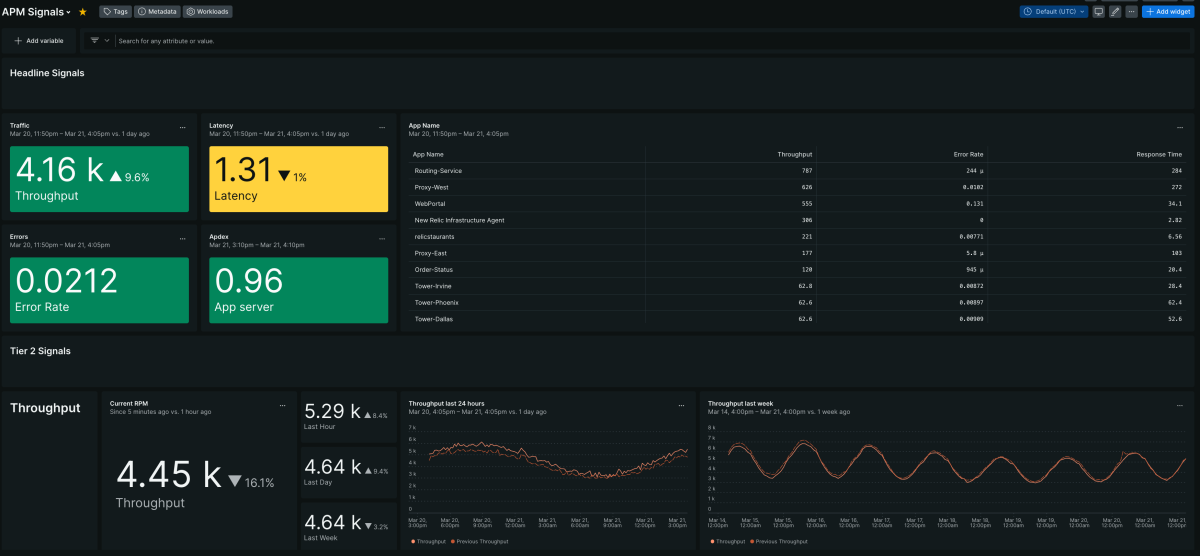
APM Signals Dashboard

1. Traffic:

  • This metric measures the volume of incoming requests to the application. The current throughput, or the number of requests processed per minute, is compared to the previous day's throughput. An increase in throughput suggests a higher demand or traffic on the application compared to the previous day.

2. Latency:

  • Latency refers to the time it takes for a request to be processed by the application. It's typically measured as the average time taken for requests to receive a response. The current average latency is compared to the previous day's average latency. A slightly lower latency indicates a marginal improvement in the application's responsiveness.

3. Errors:

  • Error rate represents the percentage of requests that result in errors or failures. A stable error rate indicates that the application is consistently handling requests without a significant increase in failures compared to the previous day.

4. Apdex:

  • Apdex (Application Performance Index) is a metric that evaluates user satisfaction based on response times. It quantifies users' satisfaction by categorizing response times as satisfactory, tolerable, or frustrating. A high Apdex score, such as 0.96, indicates that the majority of users are experiencing satisfactory response times.

5. Transaction Apdex Values:

  • Transaction Apdex Values table provides granular insights into transaction-level performance.
  • Enables precise adjustments for optimal user satisfaction.

Actionable Takeaways:

  • Identify and address performance trends through Apdex score patterns.
  • Optimize specific transactions based on detailed Apdex insights.
  • Fine-tune Apdex thresholds for applications to improve overall monitoring effectiveness.

Benefits:

  • Investigating increased traffic and ensuring infrastructure can handle the load.
  • Looking into latency spikes to determine specific events or underlying issues.
  • Monitoring error rates for unusual increases indicating application problems.

How to use this quickstart

  • Sign Up for a free New Relic account or Log In to your existing account.
  • Click the install button.
  • Install the quickstart to get started or improve how you monitor your environment. They're filled with pre-built resources like dashboards, instrumentation, and alerts.
Authors
Darren Doyle
Support
BUILT BY NEW RELIC
Need help? Visit our Support Center or check out our community forum, the Explorers Hub.