Quickstart
New Relic + FubuMVC
New Relic’s monitoring quickstart for FubuMVC monitors the performance and reliability of FubuMVC applications.
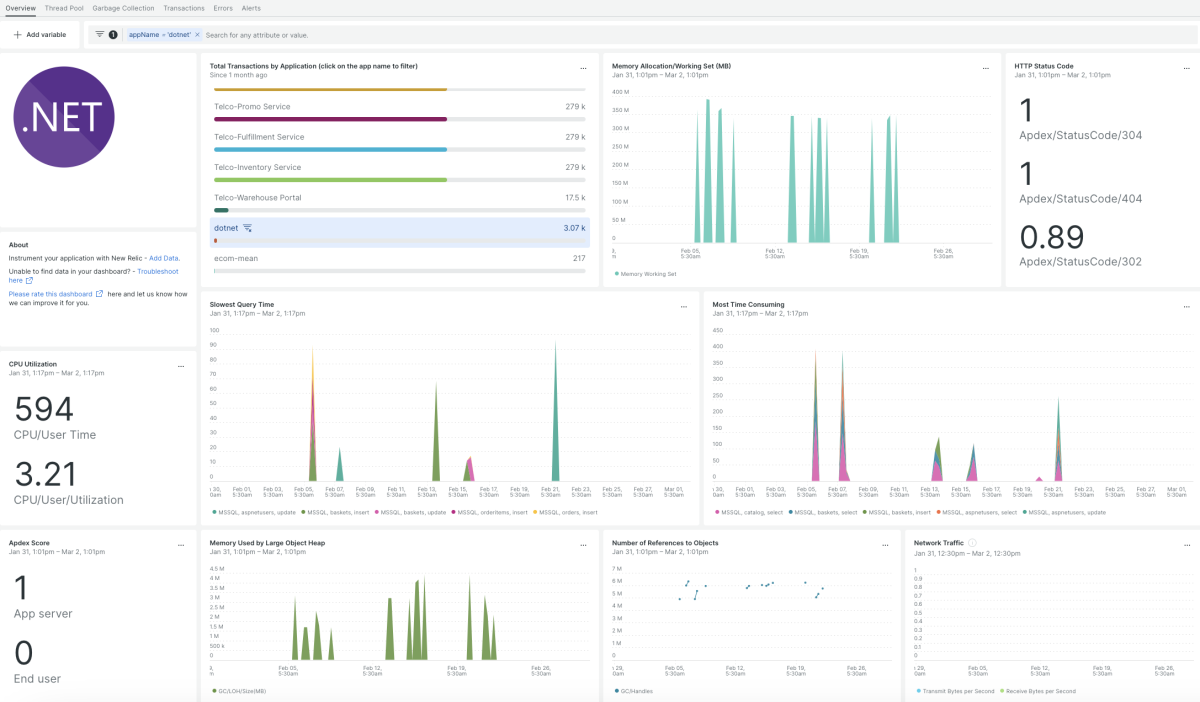
It includes visual dashboards which showcase real-time metrics of the FubuMVC stack, including:
- Errors overview
- VM overview
- Latest error display
- CPU utilization display
- Amount of memory heap used, and more. The quickstart also includes alerts when certain metrics such as the Apdex score, memory usage, and number of transaction errors hit a critical threshold.
Why monitor FubuMVC with New Relic?
Building server-side systems can be a complex process. Between dealing with incoming and outgoing HTTP requests, interfacing with other APIs and backends, the nuances of the server-side code itself, and any sort of distributed interaction or job scheduling, there are many things that can go wrong. When you monitor your Fubumvc instance, it’s much easier to spot these errors before they occur. FubuMVC fails, your whole application will too. New Relic makes it easier to prevent that failure. For example, if you get an alert when your transaction errors hit a critical a threshold, it can give you advance notice about a dead server, a network bottleneck, or an attack against your web app. Similarly, the CPU utilization dashboard helps you to know when your server load is high and when traffic might be about to overwhelm a particular HTTP service. You can address your issues proactively, before they cause an outage.
Need help? Visit our Support Center or check out our community forum, the Explorers Hub.

