Quickstart
Why monitor Feedparser?
Feedparser is a Python module that parses feeds in all known formats, including RSS, RDF, and Atom.
Feedparser runs on Python 2.4 and later versions. The New Relic Feedparser quickstart automatically instruments Feedparser with the New Relic Python agent. This allows you to instantly monitor Feedparser with out-of-the-box dashboards and alerts.
Feedparser quickstart highlights
The New Relic Feedparser quickstart has the following features:
-
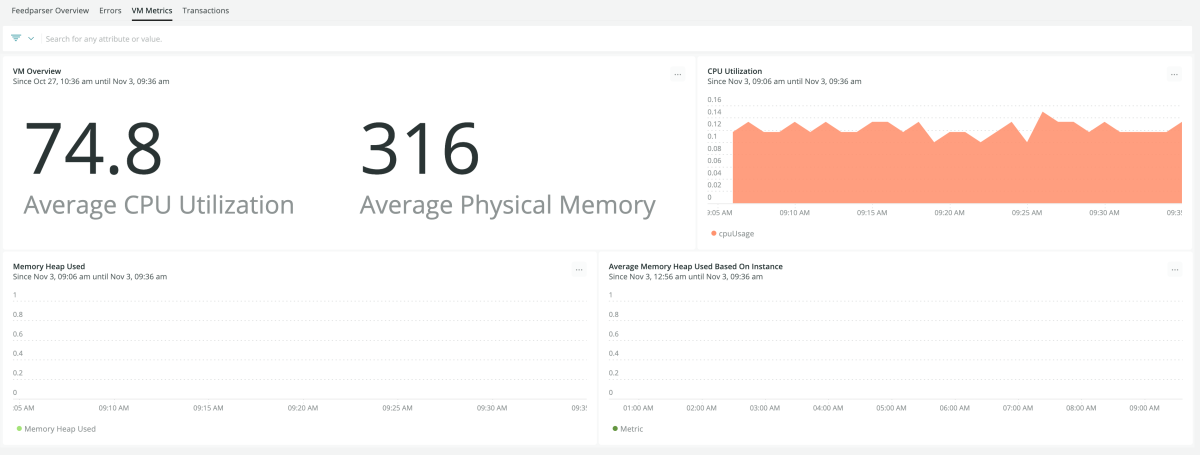
Dashboards: Our dashboards effectively monitor metrics like transactions overview, errors overview, virtual machine overview, top 10 failed transactions, transaction errors today vs 1 week ago, latest error, and more.
-
Alerts: Get instant alerts notifications on CPU utilization, high memory usage, low apdex score, and transaction error.
New Relic + Feedparser = Optimum performance monitoring
Our Python agent monitors Feedparser to help you identify issues and solve them quickly. You can also extend your performance monitoring to collect and analyze business data. The dashboards provide interactive visualizations to explore your data, understand context, improve customer experience, and make data-driven business decisions.
The Feedparser observability quickstart monitors Feedparser’s performance metrics like Apdex score, CPU utilization, and transaction errors. With this quickstart, you can track key transactions specific to your business, create custom dashboards, and get alerts for any error. It offers you the ability to drill down into performance details by examining code-level transaction traces, database query traces, and leveraging thread profiler sessions to see detailed stack traces of sampled threads.
Download the New Relic Feedparser quickstart now to monitor Feedparser’s key performance indicators and address vulnerabilities efficiently. It’s the fastest path to making sure that you detect and respond to incidents in minutes.
Need help? Visit our Support Center or check out our community forum, the Explorers Hub.

