Quickstart
Integration Features
Dashboards
Alerts
Documentation
dashboards
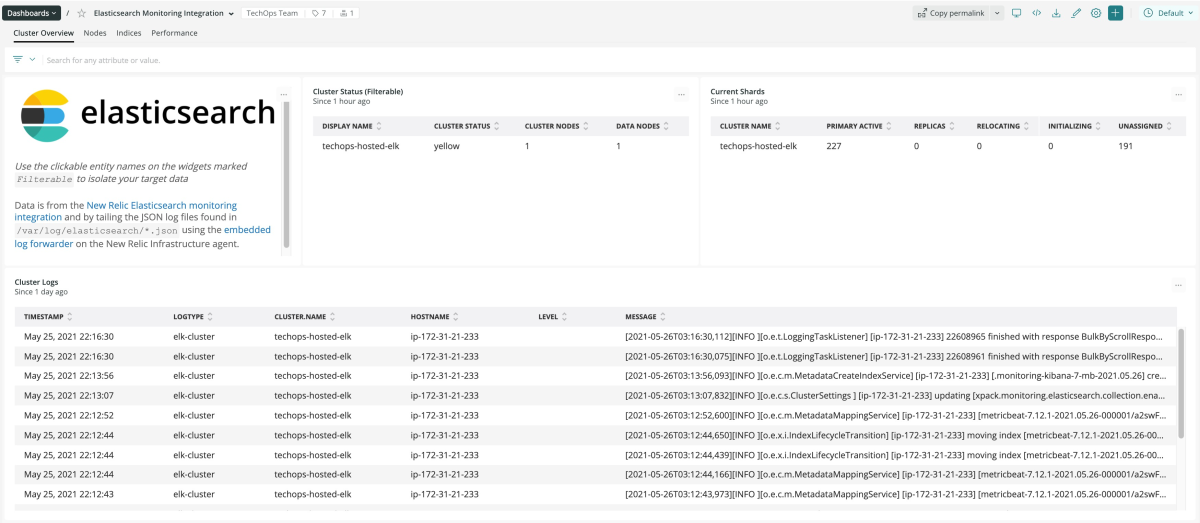
Elasticsearch quickstart contains 1 dashboard. These interactive visualizations let you easily explore your data, understand context, and resolve problems faster.
Show MoreShow Less
Elasticsearch Monitoring
See all
alerts
Elasticsearch observability quickstart contains 7 alerts. These alerts detect changes in key performance metrics. Integrate these alerts with your favorite tools (like Slack, PagerDuty, etc.) and New Relic will let you know when something needs your attention.
Show MoreShow Less
1. JVM Heap Utilization Percent
This alert will trigger when the JVM Heap utilization of an Elasticsearch cluster node is >90%.
2. Index Health
This alert triggers when the reported health of an Elasticsearch index is 'red'.
3. Query Load Baseline
This alert is triggered when the count of active queries on primary shards deviates more than 2 standard deviations above or below the baseline.
This can be a leading indicator of a potential loss of service or flood of requests.
This can be a leading indicator of a potential loss of service or flood of requests.
4. Flush Latency Threshold
This alert will trigger when the Flush latency for an Elasticsearch cluster's primary shards is >5ms.
This is measured by: # of Flushes / Time spent on Flushes (ms) for the evaluated time window.
Increased Flush Latency is an indication that your disks cannot keep up with your cluster's demands and you may need to reconfigure the 'flush_threshold_size' setting to reduce the translog size needed to trigger a flush operation.
5. Indexing Latency Threshold
This alert will trigger when the Indexing latency for an Elasticsearch cluster's primary shards is >5ms.
This is measured by: # of Docs Indexed / Time spent Indexing (ms) for the evaluated time window.
Increased Flush Latency is an indication that you are trying to index too many documents at one time and you may need to reconfigured your settings to increase performance.
This is measured by: # of Docs Indexed / Time spent Indexing (ms) for the evaluated time window.
Increased Flush Latency is an indication that you are trying to index too many documents at one time and you may need to reconfigured your settings to increase performance.
6. Cluster Health
This alert triggers when the reported health of an Elasticsearch cluster is 'red'.
7. FS Utilization Percent
This alert will trigger when the File Store of an Elasticsearch cluster node is >90% full.
documentation
Elasticsearch observability quickstart contains 1 documentation reference. This is how you'll get your data into New Relic.
Show MoreShow Less


