Quickstart
Why monitor CherryPy?
CherryPy is a pythonic, object-oriented web framework that enables developers to build web applications. Monitoring CherryPy is critical to identify and track performance metrics like apdex, key transactions, error traces, and database query traces. Proactively monitor CherryPy with our New Relic CherryPy Quickstart’s out-of-the-box dashboards and alerts.
CherryPy quickstart highlights
The New Relic CherryPy Quickstart has the following features -
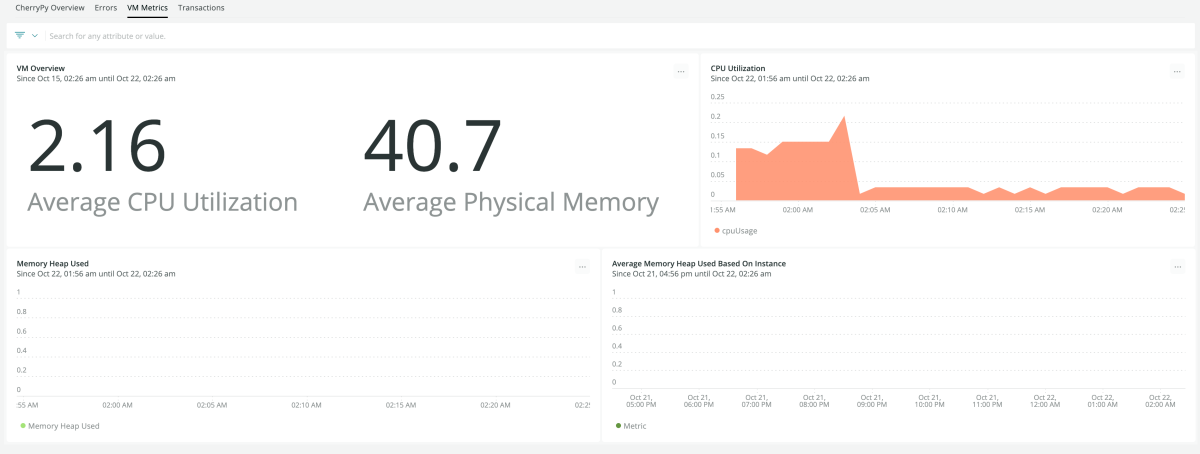
Dashboards - Monitor metrics like CPU Utilization, memory heap used, garbage collection CPU time, top 5 slowest transactions, throughput reports, and most popular transactions, and more. Alerts - including apdex score, cpu utilization and transaction tracing
New Relic + CherryPy = Optimimum performance monitoring
The New Relic CherryPy quickstart automatically instruments CherryPy with the New Relic Python agent. It empowers you to instantly monitor your application with seamless dashboards and alerts. You can also collect and analyze data to improve customer experience and make data-driven business decisions.
The CherryPy integration can be done either with the admin script integration method or the PasteDeploy method. New Relic monitors your app’s user satisfaction and quickly alerts your team when an error occurs before it affects any user. For more insights about the performance, you can drill down to examine code-level transaction traces and database query traces.
Install the New Relic CherryPy quickstart today to track key transactions, create custom dashboards for important metrics, and view performance after a deployment. It is the breakthrough to an efficient monitoring of CherryPy web server and CherryPy tools.
Need help? Visit our Support Center or check out our community forum, the Explorers Hub.

