Quickstart
Integration Features
Dashboards
Alerts
Documentation
dashboards
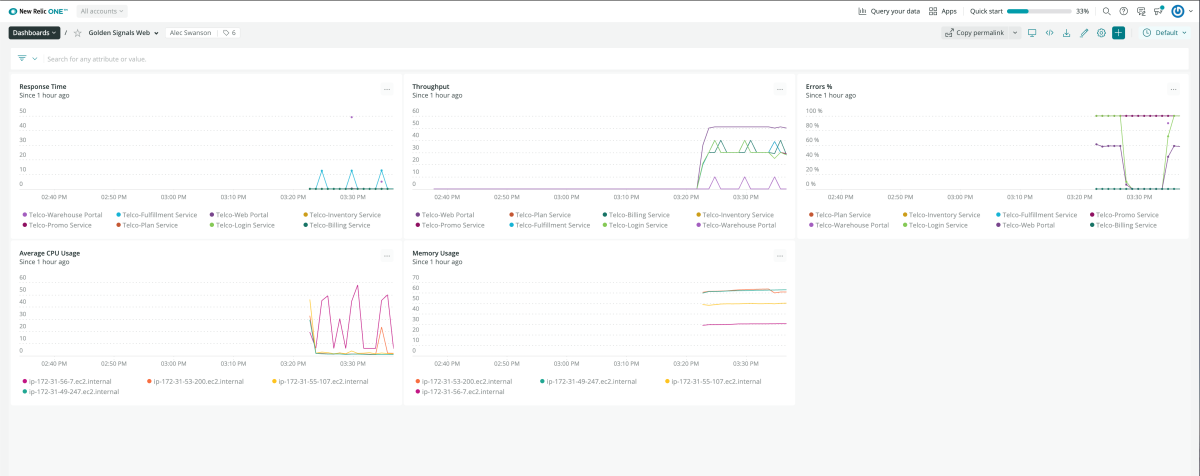
Golden Signals for Web Servers quickstart contains 1 dashboard. These interactive visualizations let you easily explore your data, understand context, and resolve problems faster.
Show MoreShow Less
Golden Signals Web
See all
alerts
Golden Signals for Web Servers observability quickstart contains 5 alerts. These alerts detect changes in key performance metrics. Integrate these alerts with your favorite tools (like Slack, PagerDuty, etc.) and New Relic will let you know when something needs your attention.
Show MoreShow Less
1. CPU Usage
This alert fires when a host's CPU usage goes above 90 percent for a period of 5 minutes.
2. Errors
This alert fires when 10 percent of the transactions against an application end with an error, over a period of 5 minutes.
3. Response time
This alert fires when the average transaction duration is above 5 seconds for 5 minutes.
4. Memory Usage
When memory limits are reached, applications can do weird and unpredictable things.
This alert fires when the percentage of memory used on a host exceeds 90 percent for 5 minutes.
This alert fires when the percentage of memory used on a host exceeds 90 percent for 5 minutes.
5. Throughput
Throughput is a great way to measure the health of your applications.
This alert fires when the throughput of a web application drops below 5 transactions in a 5 minute period.
This alert fires when the throughput of a web application drops below 5 transactions in a 5 minute period.
documentation
Golden Signals for Web Servers observability quickstart contains 2 documentation reference. This is how you'll get your data into New Relic.
Show MoreShow Less

