The collaboration between New Relic and Google Cloud continues to deliver a strong portfolio of solutions to our joint customers. The New Relic One platform already provides a differentiating “M.E.L.T in Context” observability solution for Google Kubernetes Engine (GKE) deployments. Today, we are excited to announce the support for Windows Containers on GKE and Google Cloud Anthos.
Windows Server Applications on GKE
GKE is the Google Cloud solution for managed Kubernetes clusters, providing a managed environment for deploying, managing, and scaling your containerized applications. Google Cloud now provides Windows Server container support on GKE so Windows and Linux containers can be run side-by-side in the same cluster. Windows on GKE accelerates the deployment and modernization of Windows server-based applications on Google Cloud.
Kubernetes Observability in New Relic One
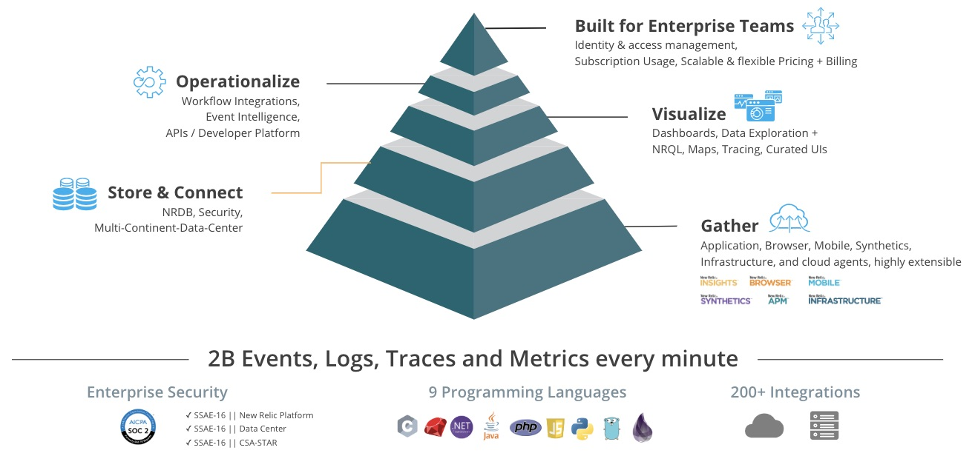
New Relic One is the industry’s first open, connected, and programmable observability platform. New Relic One delivers data gathering, visualization, and analysis of metrics, events, logs, and traces in one place—giving you full insight into your multi-cloud deployments.
New Relic One cuts through complexity, provides context, and lets you see across organizational boundaries, so you can quickly find and fix technology and business problems, and create more perfect software, customer experiences, and businesses.
New Relic One’s Kubernetes monitoring capabilities provide a unique approach to monitoring for containerized applications orchestrated using Kubernetes and deployed on a customer’s own infrastructure or public cloud services.
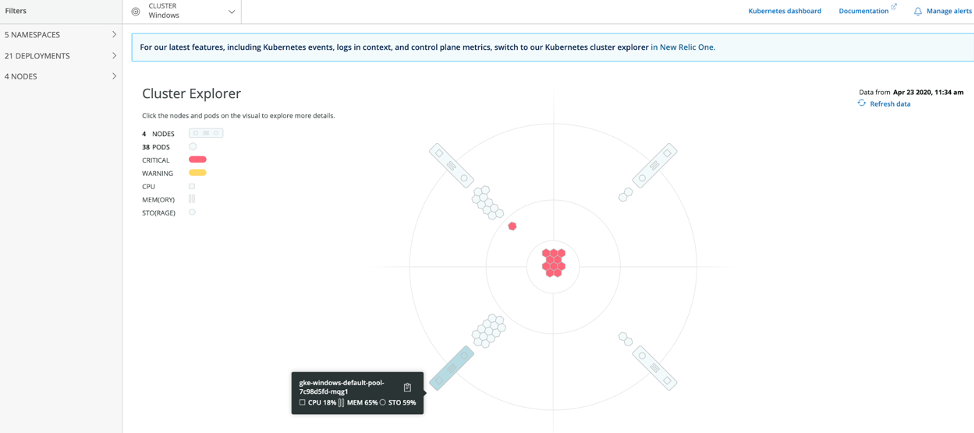
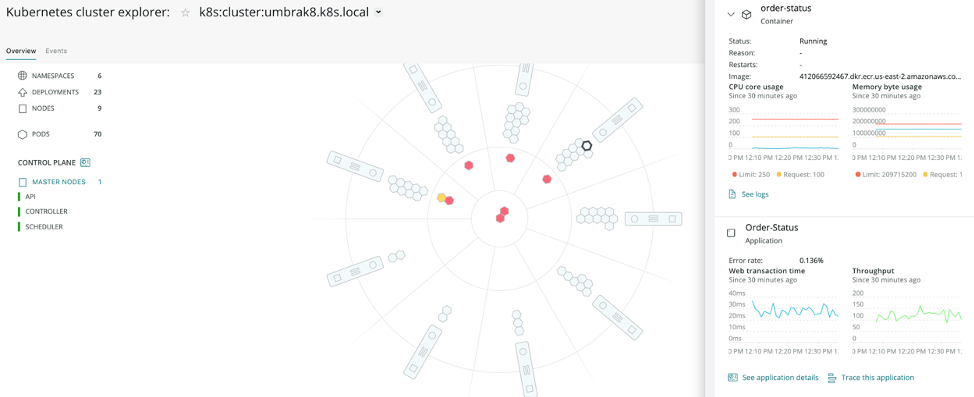
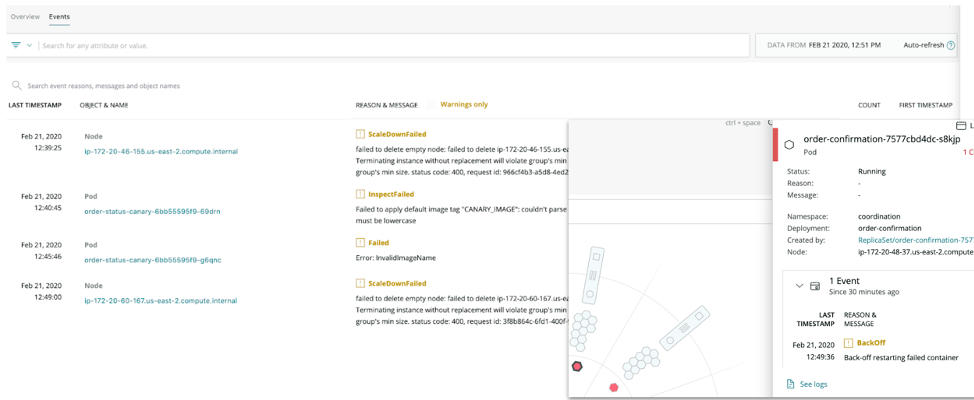
With the Kubernetes cluster explorer, New Relic provides a multi-dimensional representation of Kubernetes clusters. This allows teams to drill down into Kubernetes data and metadata using a high-fidelity, curated UI that simplifies monitoring of complex Kubernetes deployments. Teams can use cluster explorer to observe performance and dependencies across any Kubernetes environment; and to troubleshoot failures, bottlenecks, and other abnormal behavior. All of these capabilities help to ensure that our customers’ applications are always available, running fast, and delivering optimal customer experiences and business impacts.
Solution for Windows Nodes and Containers on GKE
The New Relic Kubernetes solution for GKE gives teams the ability to fully observe (metrics, events, logs, and traces) for your Windows and Linux workloads running in your Kubernetes clusters.
The New Relic Kubernetes integration surfaces the data and metadata of all the Kubernetes components—such as nodes, namespaces, deployments, ReplicaSets, StatefulSets, DaemonSets, pods, clusters and containers—allowing teams to observe frontend and backend applications as well as the underlying hosts running clusters. It also provides monitoring, alerting, and dashboards for all Kubernetes entities and services that live among your applications.
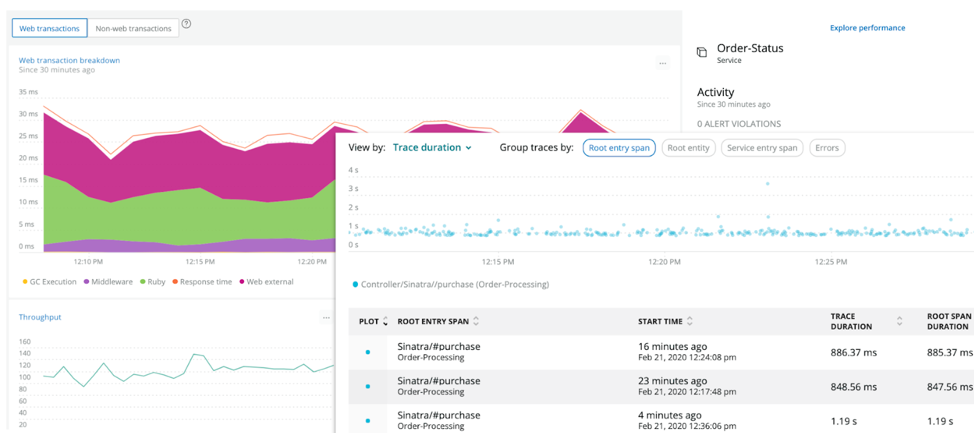
With New Relic APM, you can instrument to monitor the applications running in these containers and correlate data across the entire stack—all the way from your core infrastructure to Kubernetes clusters (and entities) to the applications.
With New Relic Distributed Tracing, you can trace the path of a request as it travels across the Kubernetes stack, discover the latency of the components along that path, and identify which component in the path is creating the performance issues. This provides for a curated dashboard experience that abstracts and demystifies the complexity of the Kubernetes and serverless deployment stack.
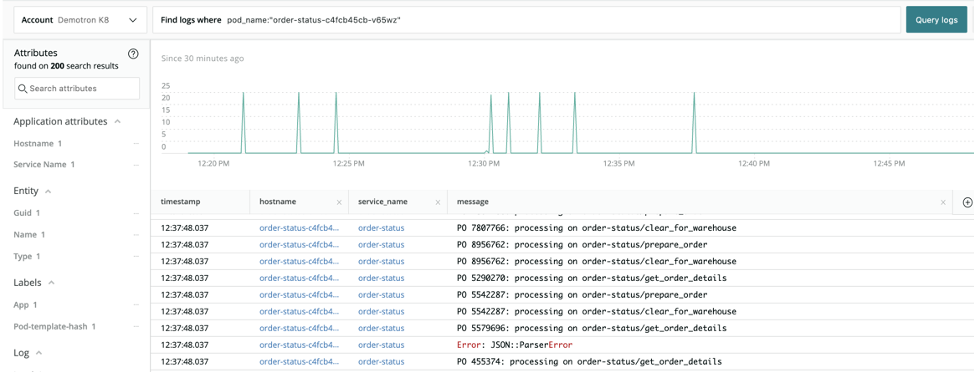
Given the natural dynamic behavior of a Kubernetes Cluster and the amount of services running on the stack, it is important to capture the logging information across these layers; providing correlation and context with metrics, events, and tracing data coming out of the stack.
New Relic Logs provides “logs in context” capabilities that focus on bringing context, curation, and intelligence into the logging conversation, leveraging New Relic application and infrastructure metrics, dashboards and data visualizations, event correlations, and other resources to paint a complete and integrated picture of a customer’s application environment running GKE.
The New Relic Kubernetes events integration watches for events happening in your GKE clusters and sends those to New Relic for correlation and visualization.
In addition, using the New Relic Istio adapter, you can monitor Istio metrics and tracing telemetry data. The newrelic-istio-adapter has a default configuration that sends metrics representing the “four golden signals” for all services within the service mesh: error rates, latency, request volume, and throughput.
Get started monitoring Windows Containers on GKE with New Relic
Once you have GKE Cluster with Windows Nodes running, the deployment of the New Relic solution follows the same pattern as for Linux Nodes through a DaemonSet definition for each operating system:
- Install the New Relic Kubernetes integration
- Install the New Relic Kubernetes events integration
- Install New Relic logging for Kubernetes
- Configure the New Relic Google Cloud integration
- Install the New Relic Istio adapter
- Install the APM agent
New Relic provides an out-of-box visualization and curated dashboarding experience to monitor your Google Cloud deployments and demystifies the complexity of enterprise Kubernetes deployments.
We are excited to partner with Google Cloud to help customers modernize infrastructure, applications, and accelerate their cloud journey.
Learn the fundamentals of what you need to know to effectively monitor Kubernetes deployments by reading our guide, A Complete Introduction to Monitoring Kubernetes with New Relic.
The views expressed on this blog are those of the author and do not necessarily reflect the views of New Relic. Any solutions offered by the author are environment-specific and not part of the commercial solutions or support offered by New Relic. Please join us exclusively at the Explorers Hub (discuss.newrelic.com) for questions and support related to this blog post. This blog may contain links to content on third-party sites. By providing such links, New Relic does not adopt, guarantee, approve or endorse the information, views or products available on such sites.

