Today we're announcing the release of metric aggregate pruning, a new tool for managing dimensional metric cardinality in New Relic One.
Our new metric aggregate pruning ability lets you create rules that tell New Relic One which attributes on your metric data are important for longer-term trending and analysis and which attributes are only relevant for troubleshooting short-term. Configuring New Relic One to “prune” the attributes that you don’t need when querying over longer time ranges helps you avoid hitting cardinality limits that reduce the usefulness of your data.
Metric aggregate pruning is the latest addition to our NerdGraph data dropping rules data management API. If you’re familiar with our cardinality limits and data dropping rules APIs and would like to get started with metric aggregate pruning right away, check out our documentation or skip to “How to use new metric aggregate pruning.”
If you’re unfamiliar with metric cardinality, we’ll briefly cover what it is, how to know if you have hit a cardinality limit, and three solutions to this problem.
What is metric cardinality?
Metrics are a key component of any observability platform. They are point-in-time measurements that represent a single data point, such as the percentage of CPU in use on a system, or an aggregated measurement, like the number of bytes sent over a network in the past minute. This makes them ideal for identifying trends over time or observing rates of change.
In monitoring, cardinality refers to the number of unique combinations of key-value pairs that exist for the attributes you include on a metric. For example, you might have a percentage of CPU in use metric, called “cpuPercent”, which you report from each of your systems. If you include a hostname attribute with this metric, so you can identify the system the metric was reported from, and you have two hosts reporting, called “host1” and “host2”, there is low cardinality. This is because there are only one hostname attribute and two unique values for the metric: host1 and host2. We would say it has a cardinality of 2. Instead, if you have a metric called “cpuPercent” metric with a hostname attribute and a process id attribute that was reported for each process on a system, and you have thousands of systems, there is high cardinality. This is because there could be millions of unique combinations of process IDs and systems.
Both low cardinality and (especially) high cardinality values are important when trying to answer questions like “Show me all users who experienced a 504 error today between 9:30-10:30 AM” as outlined in this post about the importance of high cardinality data in observability. In order to solve this problem, you’ll need to correlate a lot of data. But, you don’t want the immense amount of data to impede your ability to search it.
When you send metric data to New Relic One, not only does it store all of the raw data points you send, but it also aggregates those metrics into new data points, called rollups, at various time intervals. This makes them more efficient to store and faster to query, especially over long time windows. To ensure queries return quickly, New Relic One decides whether to use raw data points or a rollup, depending on the query.
How to know when to prune metric aggregates
Thanks to the power and scale of the underlying data platform, New Relic can easily handle data in an account with millions of unique metric time series on any given day. But as with all systems, we do have to impose some limits to protect the system and keep it performant for everyone.
If you happen to encounter one of the cardinality limits, New Relic reports an NrIntegrationError in your account, which is an event you can query using NRQL. You’ll also see it in the limits section of the Data Management Hub in New Relic One. Once a limit is hit, New Relic continues to process and store all of your data, but halts the creation of the rollups for the rest of the day. If you happen to be looking at a query that spans more than an hour of time when this occurs, it might make you think data has stopped reporting, because the rollups used for these longer time window queries are not available.
Fear not: as mentioned, the raw data you sent is still available. To access it, you can query shorter time windows (one hour or less) or append the RAW keyword to your query to pull in the data you need for troubleshooting. To avoid hitting limits altogether, you can use the new metric aggregate pruning.
How to use the new metric aggregate pruning
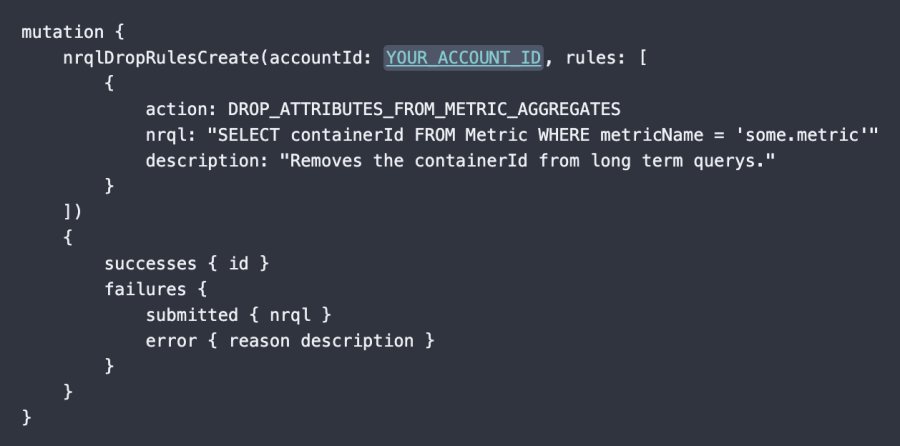
Metric aggregate pruning (DROP_ATTRIBUTES_FROM_METRIC_AGGREGATES) allows you to specify one or more attributes to exclude from metric rollups.
Metric aggregate pruning is ideal for high cardinality attributes sometimes included in metrics, such as a container ID or other unique identifiers. These high cardinality attributes contain important details when troubleshooting during an incident (narrow time window), but they lose their value over time and aren’t relevant when looking for longer-term trends.
In the following screenshot, there’s a mock example to set up pruning of the containerId attribute for a hypothetical metric named some.metric.

Additional solutions
There are two other ways that can help you avoid hitting cardinality limits:
- You can partition your data, splitting it up and sending it to multiple New Relic sub-accounts.
- You can also permanently drop low-value metrics or their attributes, either on the client-side or using our data dropping capabilities available with NerdGraph. Metrics and attributes dropped in this way are not stored at all.
Next steps
To get started, read our docs on metric aggregate pruning for detailed instructions and NRQL examples.
Are you looking for comprehensive observability for your systems? Sign up for New Relic One. Your free account includes 100 GB/month of free data ingest, one free full-access user, and unlimited free basic users.
The views expressed on this blog are those of the author and do not necessarily reflect the views of New Relic. Any solutions offered by the author are environment-specific and not part of the commercial solutions or support offered by New Relic. Please join us exclusively at the Explorers Hub (discuss.newrelic.com) for questions and support related to this blog post. This blog may contain links to content on third-party sites. By providing such links, New Relic does not adopt, guarantee, approve or endorse the information, views or products available on such sites.


