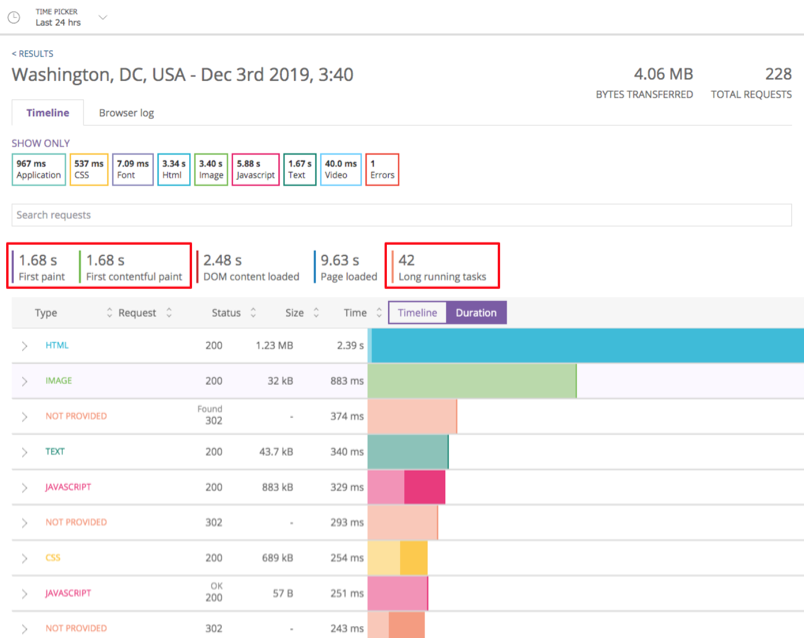
Today, web pages are as dynamic as they’ve ever been, and you need more than one metric to understand your site’s performance and your end-user experience. User-centric performance monitoring metrics are critical for frontend development teams who want to proactively measure, benchmark, and improve their digital customer experience. As a website developer, you know you can’t focus on the visual elements alone. Your customers want an engaging, responsive experience when they visit your site. Performance is critical.
Traditional metrics like page load time (historically measured by the window.onload event) are less effective for monitoring modern sites. Metrics that identify “perceived performance” can shed light on your customer experience and help you understand how fast your pages load, but speed can’t be the only thing you care about. Interactivity metrics, on the other hand, help you measure when your pages become “usable.” Where perceived performance metrics—like firstPaint and firstContentfulPaint—tells you when the user experiences something happening on the page, interactivity metrics let you know when end users can interact with the content of your page.
Further, interactivity metrics help you measure and improve customer experience by showing:
- How quickly your users can interact with visual content after your site renders it
- How quickly your users get a response after interacting with visual content
- How code-level elements of your site affect user interaction across device type, browser, or browser version
Paint metrics and interactivity metrics are part of the PageViewTiming Event
The firstPaint and firstContentfulPaint metrics give you information about when users perceive your site is ready to use, but these metrics don't always occur in a consistent or convenient time frame. In fact, we found that in many instances, firstPaint and firstContentfulPaint metrics weren’t recorded before the window.onload event, meaning that the classic "page load" time did not guarantee there was even visual content on the page.
To help teams more precisely benchmark and improve the customer experience, we’ve released three “interactivity metrics” that measure how long it takes before your web pages are usable:
firstInteractionfirstInputDelay(FID)longRunningTasksCount
In New Relic, you can query firstInteraction and firstInputDelay—alongside firstPaint and firstContentfulPaint metrics—using the PageViewTiming event.
Additionally, firstPaint and firstContentfulPaint metrics are now available in New Relic Synthetics to help you understand how long it takes your site to display content or a background. Use Synthetics to combine long-running task count metrics with firstPaint and interactivity metrics in test labs to compare those results with the same metrics collected from real user traffic in your production environment.
The PageViewTiming event sends data as it’s available, so now when New Relic sees firstPaint, the event is recorded. And FID and firstInteraction are reported together.
Note: Interactivity metrics can be collected for all browser types, but firstPaint and firstContentfulPaint are restricted to Google Chrome.
Using firstInteraction metrics
Use firstInteraction metrics to capture the moment in time when a user first attempts to engage with your site, whether by pointerdown, click, touchstart, or keydown. Along with firstPaint and firstContentfulPaint metrics, firstInteraction metrics help you understand the point at which your customers think your site is ready to use.
You can also query firstInteraction metrics using the New Relic One chart builder. For example:
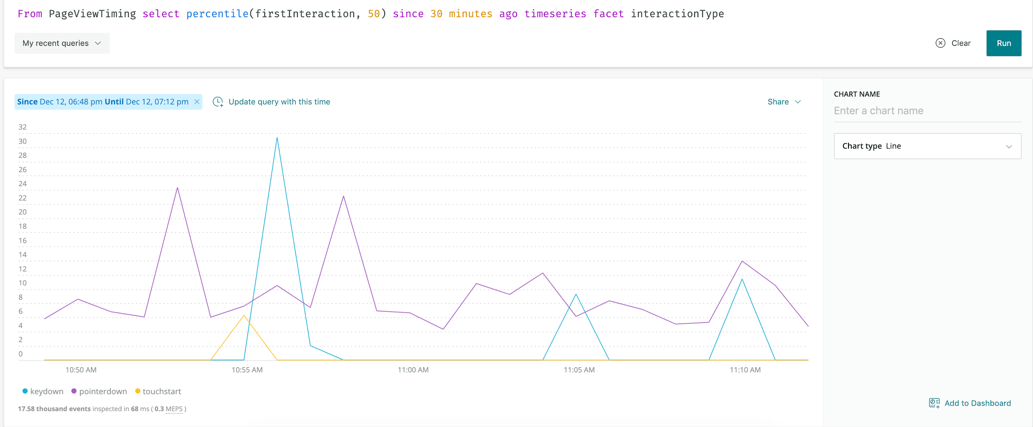
Example: firstInteraction by interaction type: Determine if certain interactions more performant than others
From PageViewTiming select percentile(firstInteraction, 50) since 30 minutes ago timeseries facet interactionType
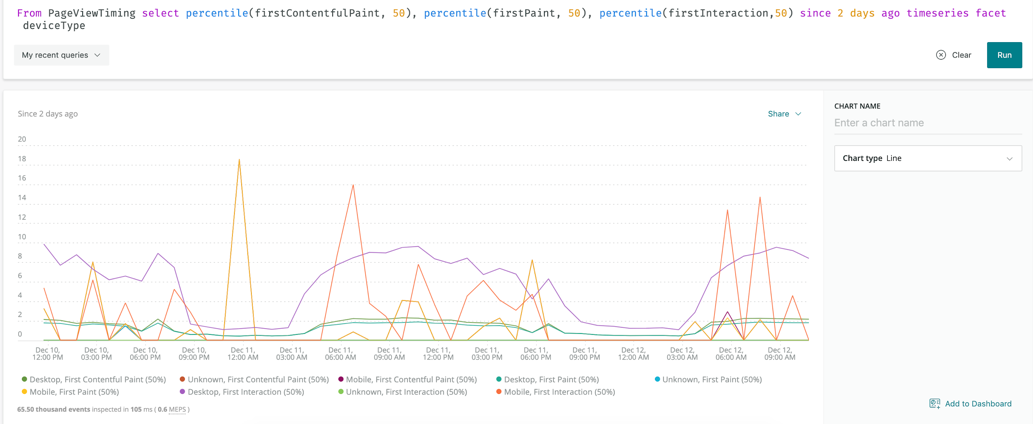
Example: firstInteraction compared to firstPaint and firstContentfulPaint: Find patterns to determine how soon your users start to engage after content is visible on the page
From PageViewTiming select percentile(firstContentfulPaint, 50), percentile(firstPaint, 50), percentile(firstInteraction, 50) since 2 days ago timeseries
Using firstInputDelay (FID) metric
Too often, site developers assume their code will run immediately after an event (e.g., a user clicks a button); however, web pages encounter delays after interactions because the browser’s main thread is busy completing some other task, and can’t yet respond to the server. For example, as explained on developers.google.com, if your app loads a large JavaScript file, the browser may not be able to run any event listeners because the JavaScript has told the browser to first complete some other task. In this case, your users experience lag.
With that in mind, the firstInputDelay metric measures the time between when a user first interacts with your site (firstInteraction) and when your site responds (in other words, when the main thread is free).
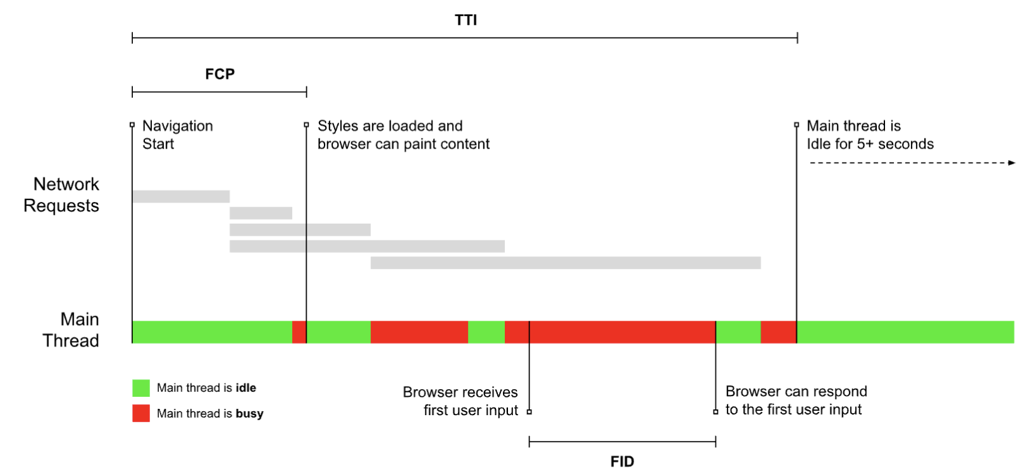
To reduce FID, consider slow-loading elements throughout your pages. In some cases, you may be able to reduce FID by changing the order of how elements load on your page; for example, load larger images or third-party components last.
You can query firstInputDelay metrics using the New Relic One chart builder. For example:
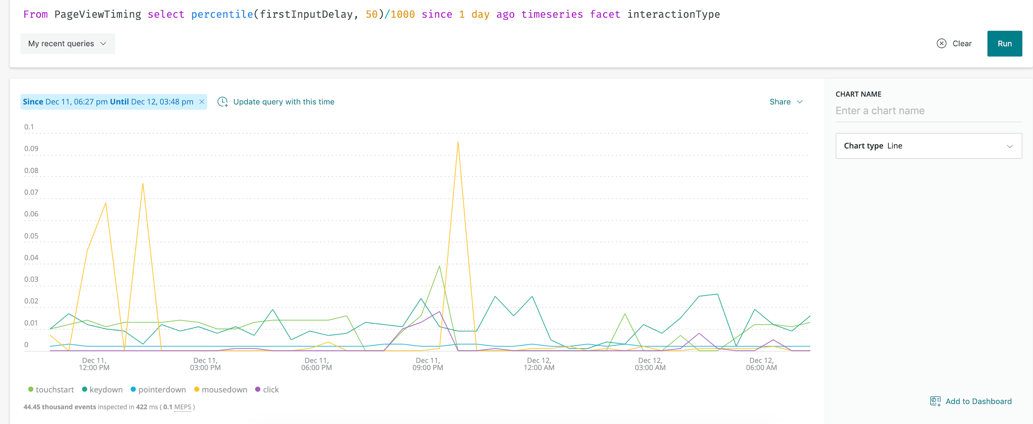
Example: firstInputDelay by interaction type: Determine if certain interactions perform better than others
From PageViewTiming select percentile(firstInputDelay, 50)/1000 since 1 day ago timeseries facet interactionType
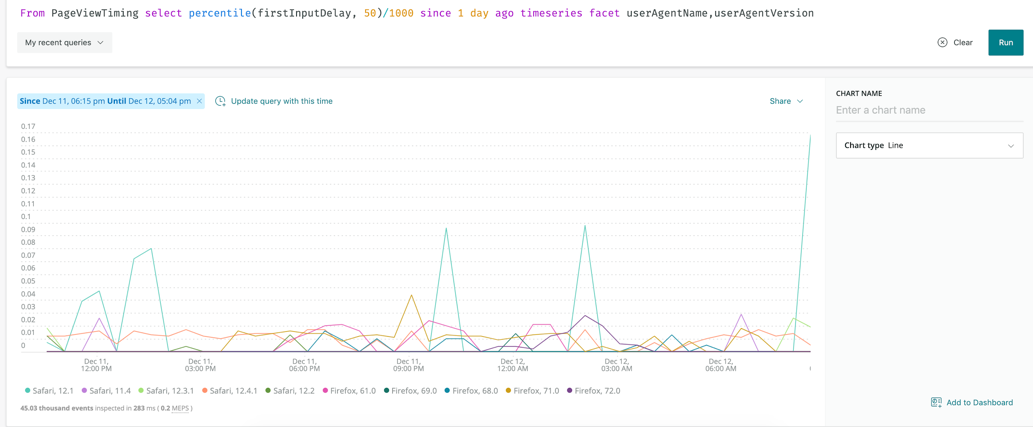
Example: Median firstInputDelay by Browser/version: Find differences in performance across browsers
From PageViewTiming select percentile(firstInputDelay, 50)/1000 since 1 day ago timeseries facet userAgentName, userAgentVersion
Using longRunningTasksCounts metrics
According to Shubbie Panicker, Staff Software Engineer for Google Chrome, “Long tasks are responsible for the majority of responsiveness issues on the web today, and scripts are by far the most common cause of long tasks.” Long-running tasks are any tasks that take longer than 50 milliseconds to complete. Since the main thread in a browser executes tasks one by one, your page’s response to user clicks can be blocked by, for example, JavaScript that’s waiting to be executed (which, again, your user experiences as lag).
Use longRunningTasksCounts to identify objects that can be optimized to improve page load performance. If any of these tasks occur before site content loads, improve those processes first.
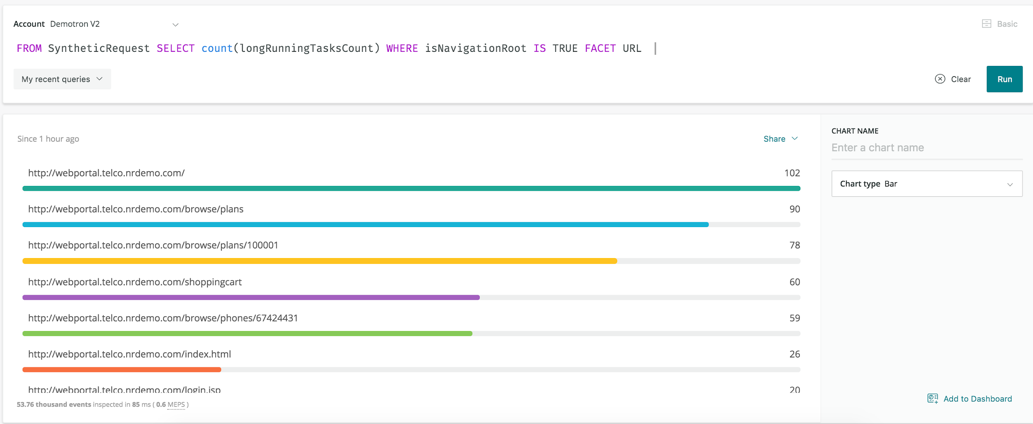
You can find longRunningTasksCount in Synthetics, tracked by a count of how many instances occur per page. These are captured in Synthetics alongside firstPaint and firstContentfulPaint metrics.
They’re also available for query within New Relic One dashboards.
Example query: Track how many long-running tasks you have, per URL
FROM SyntheticRequest SELECT count(longRunningTasksCount) WHERE isNavigationRoot IS TRUE FACET URL
Three key uses for interactivity and perceived performance metrics
Ultimately, your users demand that you pay attention to the performance of your website. From measuring when your page first displays a background or content to the length of time before your users can interact with the site to fine-tuning your site’s responsiveness by understanding how your code impacts the browser’s main thread—there’s a lot of work to be done.
Here are three ways to use interactivity metrics alongside perceived performance metrics:
- Improve customer experience. Correlate perceived performance metrics to larger business KPIs and find direct links between how fast your pages display content and the amount of page views you receive; or compare how quickly your pages were ready for interaction to the amount of ads clicked in a given time period. Benchmark such customer-centric experiences, and use those measurements to plan longer-term web page optimization projects.
- Eliminate performance issues in pre-production and monitor them in production. Use synthetic monitors in a staging environment to ensure that new code doesn’t negatively impact your users.
- Write code, utilizing performance budgets.
- Test code in a lab environment using synthetic monitoring and proactively eliminate issues by identifying them before a deployment.
- Deploy code and use alerts and telemetry data to immediately identify regressions.
- Deploy real user monitoring in production environment to measure your true customer experience across geographies, devices, and networks.
- Perform competitive benchmarking. If possible, allocate resources to your web development teams to enhance page speed optimization. Understand where you stand compared to your competition and plan to be at least 20% faster for good measure.
Interested in learning more about how New Relic supports the digital customer experience? Review this best practices guide for monitoring web and mobile sites.
The views expressed on this blog are those of the author and do not necessarily reflect the views of New Relic. Any solutions offered by the author are environment-specific and not part of the commercial solutions or support offered by New Relic. Please join us exclusively at the Explorers Hub (discuss.newrelic.com) for questions and support related to this blog post. This blog may contain links to content on third-party sites. By providing such links, New Relic does not adopt, guarantee, approve or endorse the information, views or products available on such sites.

