Anyone responding to an incident knows that every minute counts. We understand this. In fact, we’ve been hard at work building AIOps capabilities into New Relic One to save you time when issues require your fastest response. Check out this roundup of five new capabilities that ensure you have crucial information you need when you need it.
Anomalies in the activity stream
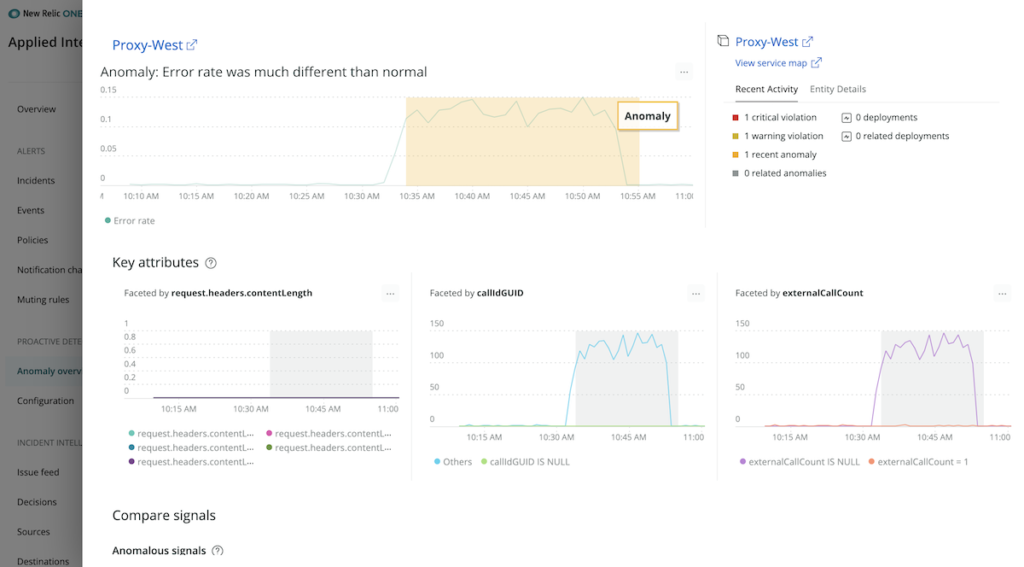
A holistic view of your system and data helps speed incident response, so we’ve further integrated Applied Intelligence capabilities into New Relic One by providing anomalies in context alongside APM information. Understanding how recent operational events affect your system is critical for observability and fixing outages quickly.
The activity stream—visible from the New Relic One homepage, APM summary page, and APM list page—displays recent events from alerts and deployments and provides a direct view into what has changed in your system.
Now, for even more context, detected anomalies are also available in the activity stream of the New Relic One homepage and on the APM summary page. Click through from either location for an in-depth anomaly analysis.
Bringing anomalies into your common workflows will save you time and increase your situational awareness so that you can more quickly understand changes and respond to incidents faster.
After you configure your application, Applied Intelligence Proactive Detection will post open and closed events to the activity stream for specific time windows. For faster troubleshooting, click on any event in the activity stream for event analysis— including related anomalies, suggested queries, and other relevant metrics. Additionally, you can configure Proactive Detection to send anomaly notifications and analysis to Slack and other notification channels or the Telemetry Data Platform for future analysis.
Start now by configuring Proactive Detection and get 100 million free app transactions every month—it only takes a few minutes to get it up and running.
Issue summary and analysis
When trying to find the root cause of an issue, access to contextual information is crucial. With that in mind, we’ve made it easier to find relevant issue information and analysis.
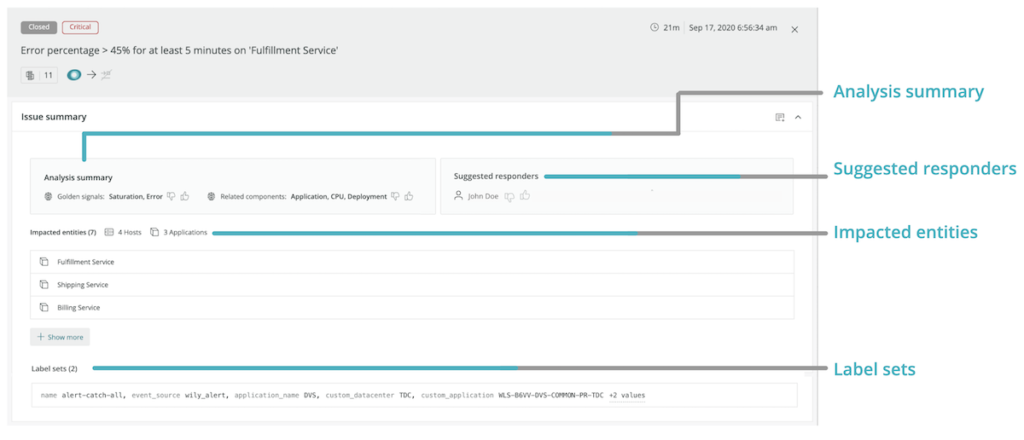
The issue summary provides bottom-line insights to get you information faster. Depending on the issue, it can contain up to four sections:
- Analysis summary: Surfaces related components and SRE “golden signals” (e.g., error rate, throughput, saturation, and latency)
- Suggested responder: Suggests the most relevant responders who can help to resolve the issue
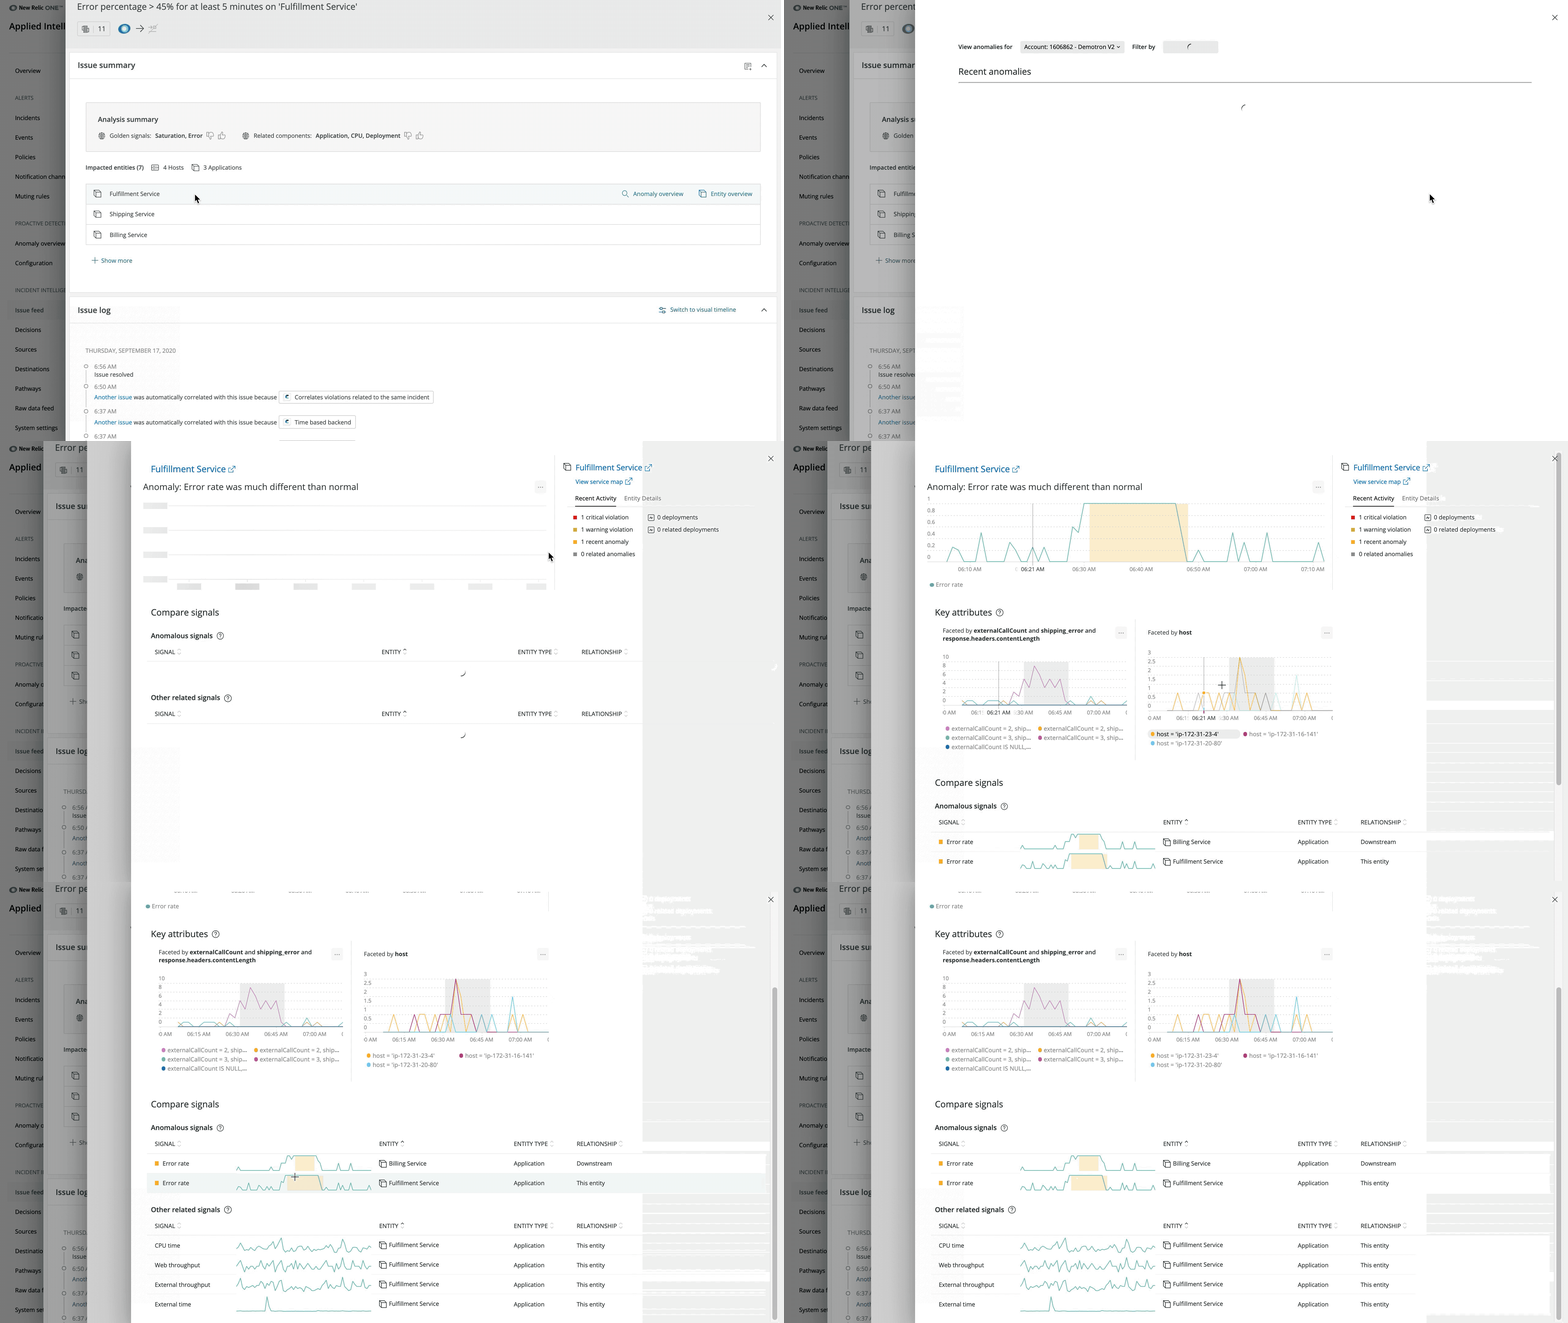
- Impacted entities: Shows a summary of any entities we monitor with one-click access to anomaly analysis if you’ve configured Proactive Detection
- Labels sets: Shows incidents from third-party sources (e.g., PagerDuty, AWS CloudWatch, etc.)
With these updates to the issue summary and analysis, more information is always a click away.
Visual issue timeline
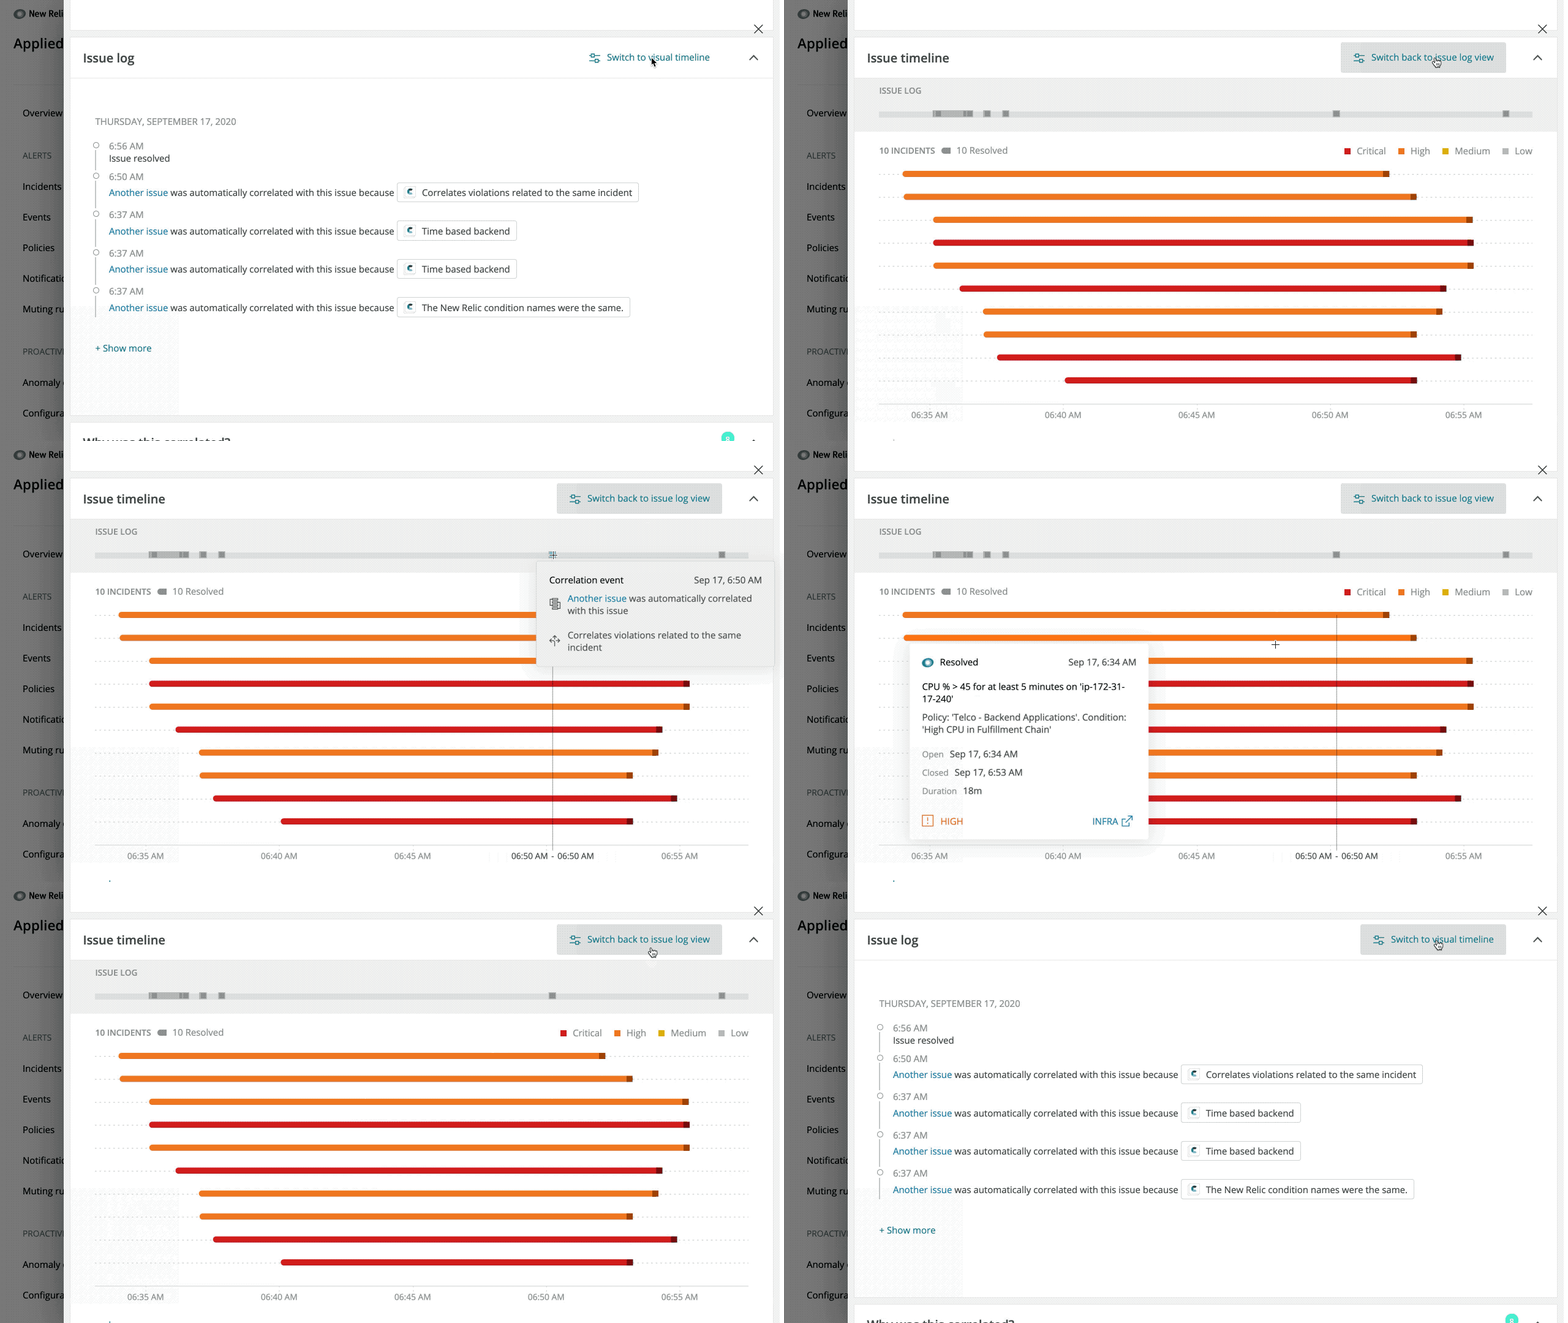
Good visuals lead to faster understanding of how events have played out over time (and how one event had led to another). To this end, we’ve created a Gantt-style chart that shows a timeline of related events on the Incident Intelligence issue page.
The timeline is available to all accounts that have configured Incident Intelligence. Click View Visual Timeline and scroll over individual incidents for more information.
Accelerated suggested decisions
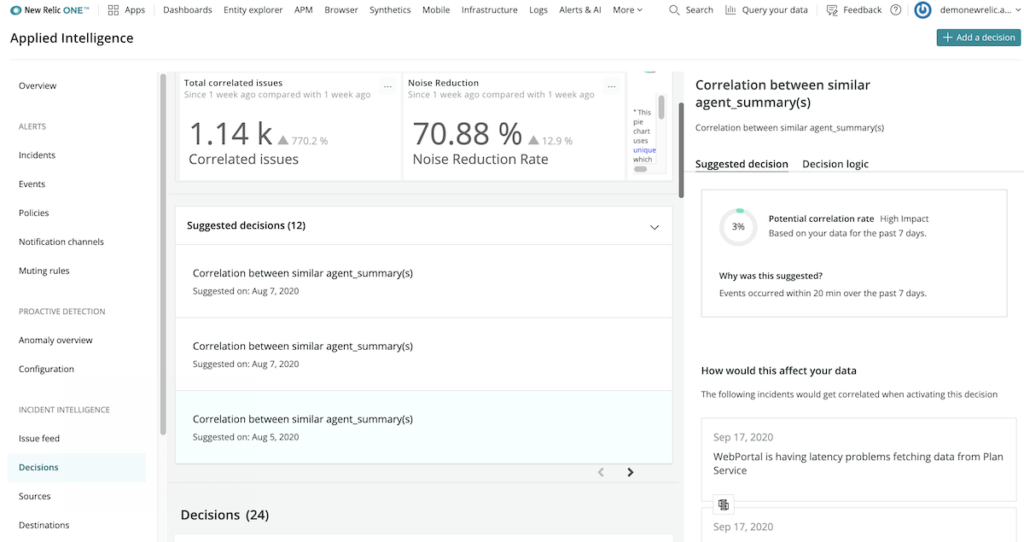
Incident Intelligence continuously analyzes alerts and incident data to find patterns in event sequences and offers suggested correlation decisions that merge incidents to further reduce alert noise.
Decisions tailored to your data more accurately correlate issues, and we surface those as suggested decisions. Usually, we can create suggestions after a few weeks of use and data ingestion. However, if you’re an existing New Relic user, we can now leverage your historical New Relic Alerts data to bring you tailored suggested decision logic in a matter of days.
You won’t need to perform any additional configuration—choose the alert policies you want to feed in for correlation as usual, and we’ll take care of the rest. The more policies you add, and the more data made accessible, the better the suggestions you’ll receive. Be sure to set up your New Relic alerts source to take advantage of this new capability.
Scheduled alert muting
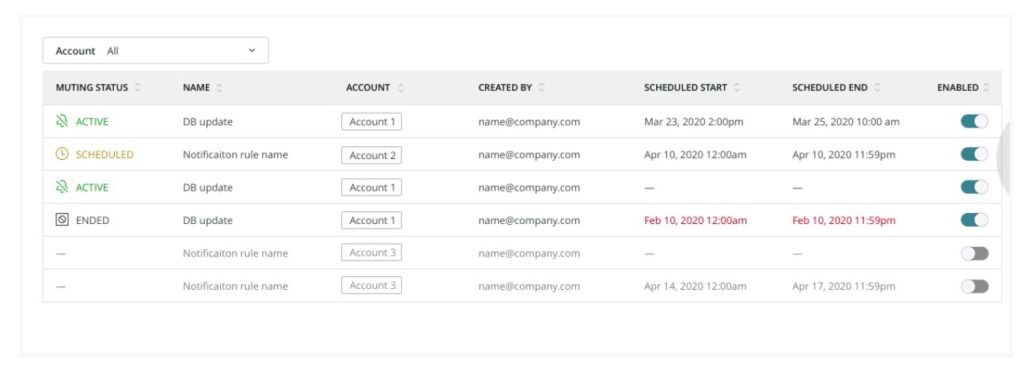
When you have a deployment or maintenance scheduled, the last thing you want is a bunch of alerts firing, stealing your time and distracting you from what could possibly be real issues. Wouldn’t it be nice to be able to schedule alert muting for those cases? We thought so, too!
Now you can schedule a window of quiet when you know important work is coming. For more information, check out this post on the Explorer’s Hub or learn more about muting rules in our docs.
Curious about how to get ready for these capabilities, or New Relic Applied Intelligence in general? Don’t miss our ebook, How to Prepare for AIOps: Four steps for a successful deployment.
The views expressed on this blog are those of the author and do not necessarily reflect the views of New Relic. Any solutions offered by the author are environment-specific and not part of the commercial solutions or support offered by New Relic. Please join us exclusively at the Explorers Hub (discuss.newrelic.com) for questions and support related to this blog post. This blog may contain links to content on third-party sites. By providing such links, New Relic does not adopt, guarantee, approve or endorse the information, views or products available on such sites.

