This week, we released the C SDK to use with New Relic APM 360 to help you to shine a light on applications where you currently may not have good visibility of performance. The C SDK provides the same level of production visibility offered by our seven other language agents—Java, PHP, .NET, Ruby, Python, Node.js, and Go—to give you coverage for an ever-wider variety of apps.
The power of C
Instrumenting C applications shines a light into some of the important but often forgotten corners of the internet. Though not always talked about in terms of common customer-facing web applications, C and C++ power the software world in a number of fundamental ways. C is one of the oldest programming languages still in common use, and the foundation for many modern languages. Many newer languages have interfaces to talk to C libraries, including Rust, Lua, Swift, and Perl.
C and its close cousin C++ are still used extensively due to their singular focus on performance and efficiency. Many core or highly complex applications, including games, GUI-based applications, and highly complex data manipulations—where efficiency is paramount—are written in C or C++. Some of these applications have millions of lines of code, are very long-lived, and over time have been touched by many software developers, some of whom may have left the organization years ago. At the same time, C and C++ are the languages of choice for coding embedded systems and internet of things (IoT) devices. Gaining insight into performance issues with these applications can result in significant cost savings and deliver a significant competitive advantage.
At New Relic, we see more and more customers who need insight into their extensive collections of C and C++ code. They have been using New Relic to monitor their modern applications and want to extend that visibility even deeper into their business. We also see strong affinity for C-friendly languages like Rust. The C SDK brings the full benefits of the New Relic platform to applications written in C and C-friendly languages.
Don’t miss: The Most Popular Programming Languages of 2018
New Relic’s C SDK
The New Relic C SDK includes an API that you can use to instrument any application written in C or in a language that supports a C foreign function interface (FFI).
The C SDK works with New Relic APM to monitor a wide range of applications. This initial C SDK release supports instrumenting the often complex, multi-threaded nature of C and C++ applications, or you can instrument a single transaction.

We released the C SDK as a new open source software project on New Relic Github. Making the C SDK fully open source makes it easier for customers to adopt, test, distribute, and deploy it across a variety of platforms and package managers. We are eager to get contributions from users, and to use Github as another way to directly engage with the developer community.
To use the SDK, you directly instrument your application. (It is not possible to auto-instrument compiled languages such as C or C++.) This lets you control exactly what gets instrumented, and give you the opportunity to add custom attributes to tie performance to business metrics. With just a few lines of code, the C SDK lets your application report transaction tracing and other real-time metrics vital to understanding the health and performance of your application.
The initial release of the C SDK supports:
- Transaction instrumentation: Generate transaction traces, monitor throughput and response times and other available metrics for web and non-web transactions. This includes slow query trace details for supported SQL-based database platforms.
- Segment instrumentation: If a transaction is already visible in New Relic, but you do not have enough data about a particular method called during that transaction, you can instrument segments. For example, if you want to time a method that has complex logic, you can create a segment for each method in the transaction.
- Error instrumentation: Collect and troubleshoot errors, then view error details from the APM overview page, error analytics page, and error profiles page.
- Custom events, attributes, and metrics: Create custom events and metrics, and customize the attributes attached to transactions for visibility in New Relic Insights. Customizing attributes lets you collect additional attributes for deeper visibility into your transactions and can help you avoid sending attributes you want to keep in house.
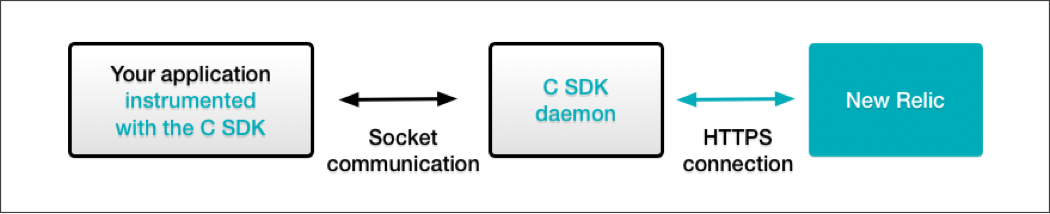
Behind the scenes
The C SDK relies on two components to send data from your application to New Relic:
- The library of New Relic C SDK calls: You download this library, then add the calls and instrumentation to your application's code. This lets you identify and customize the data that matters most to you.
- The C SDK daemon: This file accumulates data identified in the calls from your application's code, and sends it to New Relic.
Go forth and instrument!
The C SDK is available now to the world. If you have C, C++, or C-friendly applications you need to monitor, have a look at the C SDK documentation for an overview, and to confirm that your system meets the compatibility requirements, then check out this easy-to-use guide. You can also familiarize yourself with our documentation on Github and with the list of C SDK calls. When you’re ready, instrument, compile, and link your code to the C SDK, start the daemon… and start seeing your C application performance metrics in New Relic APM!
Resources
- New Relic C SDK documentation
- Guide to using the C SDK API
- Github C SDK documentation
- List of C SDK calls
- Download the C SDK from Github

The views expressed on this blog are those of the author and do not necessarily reflect the views of New Relic. Any solutions offered by the author are environment-specific and not part of the commercial solutions or support offered by New Relic. Please join us exclusively at the Explorers Hub (discuss.newrelic.com) for questions and support related to this blog post. This blog may contain links to content on third-party sites. By providing such links, New Relic does not adopt, guarantee, approve or endorse the information, views or products available on such sites.


