Today, New Relic is launching an integration with Amazon Security Lake, so you can collect multi-region, multi-account security data from across your microservices infrastructure and analyze that data in New Relic. By sending Amazon Security Lake logs to New Relic, you get a more complete understanding of security across your entire organization to protect your workloads and data.
Security detection for modern software systems is challenging, because systems are complex, constantly evolving, and come with multiple components and dependencies. And software systems generate a vast and ever-growing volume of data from logs, network traffic, and system events. Combing through this data is time-consuming and difficult. In addition, working across a dynamic range of technologies, diverse programming languages, different operating systems, and cloud environments makes keeping up with security threats extremely onerous.
Amazon Security Lake solves this problem by allowing you to aggregate, store, analyze, and monitor security-related data in a scalable and cost-effective manner in your own Amazon Web Services (AWS) account. You can collect and centralize logs from all of your accounts and regions in a standard Open Cybersecurity Schema Framework (OCSF) format, either storing the data in Amazon Security Lake or sending to third parties, such as New Relic. For more details, see Amazon Security Lake.
Using Amazon Security Lake with New Relic
Amazon Security Lake collects logs across multiple Virtual Private Clouds and AWS accounts. The easy one-time setup in New Relic brings AWS Security Lake logs into four dashboards developed specifically for these AWS sources:
- Amazon Virtual Private Cloud (VPC) flow logs
- Amazon CloudTrail
- AWS Security Hub
- Amazon Route 53
While New Relic already supports most of these features individually, Security Lake allows you to keep up with all of these security features across multiple accounts, and in a single data stream into New Relic. I’ll walk through use cases for each of these sources of log data in the next sections.
Amazon VPC flow logs
To ensure your VPCs are secure, sending your VPC flow logs to New Relic gives you visibility into your network activity to quickly detect issues in your network performance. The flow logs are records of network traffic to and from the different resources within your VPC. This integration helps you:
- Monitor your network traffic within and between your VPCs.
- Visualize performance metrics like bytes and packets.
- Detect unexpected deviations in network volume or health.
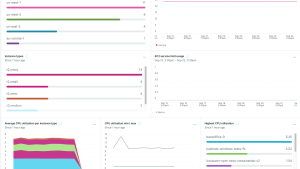
This screenshot shows Amazon Security Lake-VPC flow logs data displayed in a New Relic dashboard.
Amazon CloudTrail logs
CloudTrail provides insight into all account activity across your AWS infrastructure. Use the New Relic integration to:
- Detect security-related incidents.
- Monitor operational issues and inefficiencies.
- Identify and isolate unusual operation activity, IP activity, API errors, and more.
This screenshot shows Amazon Security Lake-CloudTrail logs data displayed in a New Relic dashboard.
AWS Security Hub
Security Hub gives you direct insight into the security posture of your AWS infrastructure, enabled, in part, through security alerts. By sending this data to New Relic, you’ll stay up to date with the latest security vulnerabilities, making it convenient to take decisive action when issues are detected. The monitoring for this service provides:
- A curated view of high and critical priority Security Hub issues
- An overall compliance status across all of your accounts and regions
- A real-time stream of security compliance failure logs, including how to resolve them
This screenshot shows Amazon Security Lake-Security Hub log data displayed in a New Relic dashboard.
Amazon Route 53
An effective system of DNS monitoring is critical to the reliability and security of your website, helping you detect and resolve malicious attacks on your domains and services. The Route 53 (resolver query) logs show key data about your DNS queries, helping you to:
- Visualize your resolver query traffic to help allocate resources effectively and improve your architecture.
- Monitor domains or instances where your queries are unsuccessful.
- Detect unusual activity on your Route 53 Resolver.
This screenshot shows Amazon Security Lake-Route 53 Resolver query log data displayed in a New Relic dashboard.
Next steps
To begin exploring how to instrument Amazon Security Lake with New Relic, check out our Security Lake documentation and quickstarts.
If you’re not already using New Relic, sign up for a free account. You get100 GB/month of free data ingest, one free full-platform user, and unlimited free basic users.
The views expressed on this blog are those of the author and do not necessarily reflect the views of New Relic. Any solutions offered by the author are environment-specific and not part of the commercial solutions or support offered by New Relic. Please join us exclusively at the Explorers Hub (discuss.newrelic.com) for questions and support related to this blog post. This blog may contain links to content on third-party sites. By providing such links, New Relic does not adopt, guarantee, approve or endorse the information, views or products available on such sites.


