Building a tech stack that meets business needs is challenging. When two businesses merge, consolidating those tech stacks is another challenge entirely. In 2021, Dustin, a leading online IT partner, acquired Centralpoint. As a web development manager at Centralpoint, my team was tasked with consolidating the stacks, both with completely different toolsets and architectures.
Merging two tech stacks: New Relic vs. Datadog
Choosing the tools and approaches to use when merging tech stacks isn’t just about which technology is best in show. Teams often have strong preferences and experiences that we need to measure against cost-effectiveness and ability to scale. We also had to factor in cultural considerations around how both companies made decisions.
Before the acquisition, Centralpoint maintained a cloud-native stack monitored by New Relic. Centralpoint had already made the jump from private to public cloud with Amazon Web Services (AWS) in 2019. During this time, Centralpoint had amped up infrastructure and logs monitoring. Dustin maintained a highly modern application stack but the infrastructure was based on on-premise data center technology. They hosted the data themselves and relied on the infrastructure team to keep Kubernetes clusters up to date. Dustin’s stack was still on a private cloud, and their engineers were committed to Datadog.
We had to figure out which technologies from each stack could be combined to offer us the best solution going forward. We decided to combine the Dustin application stack with the Centralpoint infrastructure-as-code architecture, which left only the question of which observability solution to use for the combined organization.
The decision between Datadog and New Relic came down to a matter of cost and utility. At Dustin, developers were using Datadog as an almost enriched logs aggregator, using it to parse through logs. At Centralpoint, our use of New Relic ran far deeper. We had been using New Relic for monitoring and alerting for nearly eight years, and we expanded our use when we transitioned from a private cloud to AWS. By the time we were acquired by Dustin, we had a mature practice for both application performance monitoring (APM) and logs.
In the end, we decided to move the entire new tech stack onto New Relic for cost and maturity reasons. Another important factor in the decision was the close relationship with New Relic at an engineer level, we had continuous feedback and feature requests. Getting started with New Relic was easy, there’s a lot of documentation and a big community behind it. The biggest challenge was the technical enablement. Showing developers what capabilities are available and what developers can do with the platform. Once this decision was made, we were able to focus on the next phase of our technology evolution.
Driving a DevOps transition
We knew that the post-acquisition tech stack would feature a public cloud architecture. When we made that transition, we decided to adopt a full in-house DevOps model and move away from our infrastructure-as-a-service mindset. For the full team to take the responsibility necessary to achieve DevOps, we needed more and better information than we had previously.
An acquisition offers a strong opportunity to identify where you may be wasting or misusing resources. We found that both companies were likely putting too much or no valuable data in their logs and monitoring tools. This happens easily over time when you have many different people dealing with a tool in a company. Once you scale you need to start thinking about what data you want presented and the information messages you want in your production environment. The consolidation helped us nail down insights on what we wanted to see and use. We’re now working on optimizing New Relic to meet our needs, using the right data volume that corresponds to our resources.
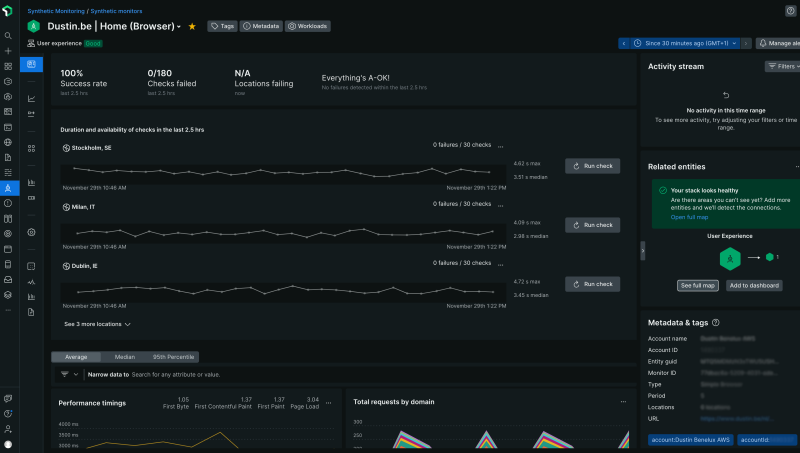
We committed to using New Relic for APM, browser, logs, and infrastructure to support our DevOps model. Distributed tracing follows service requests as they flow throughout the organization, and this visibility is essential for informing our new, streamlined operations. Connecting AWS and sending logs from there to New Relic was a no-brainer follow-up step for us. As a team, our goal is to move from taking a retrospective approach to engineering and incident response and instead adopt a proactive mindset.
Embedding security in applications with Security RX
We are using multiple tools to scan our applications for security risks. One tool gave us PDF results, which we had to compare with previous PDF results to see an increase or decrease. It was not user-friendly. We also use the container scanner in Gitlab as an integrated part of our pipelines for deployment. We scan the containers we are deploying. These containers contain the application but also the most kernel-related business packages we have.
It’s not enough to know what vulnerabilities are in the application but also how to fix them—knowing what needs to be removed or remediated. We want to develop our security monitoring strategy to include things like alerts and reports so that our developers have data to act on. We want all of that to be in the same monitoring tool so everyone has the same reference of data.
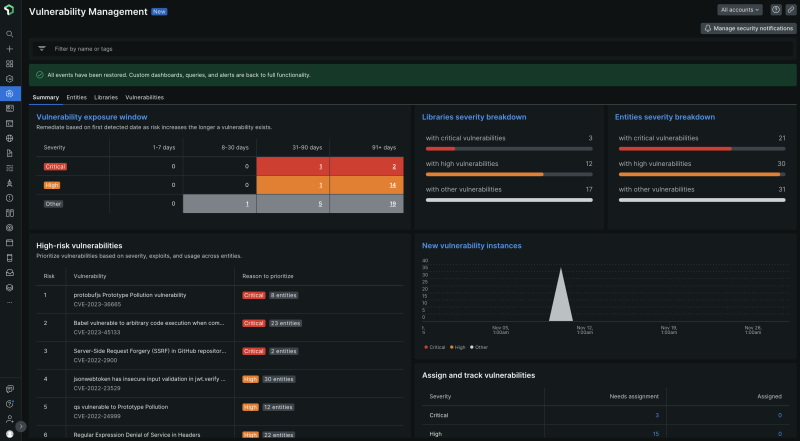
New Relic Security RX provides zero-configuration security insights and is a tremendous opportunity for us. Alert fatigue is another reason why we wanted security factored into one monitoring tool, to make sure that when we did get an alert, it was accurate and valuable.
Security RX will help us integrate security into the development cycle from the get-go so that teams are responsible for integrating security concerns into their microsites. Security RX helps developers see and own the security status of their applications, rather than just giving that ownership to the security team. When a feature request is fulfilled, we get the true view scatter results. Developers can look at dashboards to see any security issues flagged, in addition to updated packages that need patching. When grooming, everyone can see the data and the action they need to take.
From DevOps to DevSecOps
When scanning a pipeline with a container scanner you typically get a black screen with white text. By allowing New Relic Security RX to scan your application on-boot, you get a user-friendly overview to get into production or runtime and see results—but then you need to do something with that information. You need that cultural change too. Previously a security team member would create tickets from the data. We want to move away from that and work in a more agile way, making teams developing the application responsible for their own problems. That relies on the maturity and agile mindset of the team, not just the tooling. That’s something we’re working on now.
Moving forward
Making tailor-made dashboards is also the way forward within our teams. Showing important aspects or information is more efficient than just digging into logs. Custom New Relic events are emitted by our applications and visualized in dashboards using NRQL helping us verify and validate application flows faster than before. New Relic Groundskeeper helps us stay up to date with application dependencies and packages.
The Kubernetes overview is the most effective way to assess the health of the cluster and our deployments with just a quick glance.

The views expressed on this blog are those of the author and do not necessarily reflect the views of New Relic. Any solutions offered by the author are environment-specific and not part of the commercial solutions or support offered by New Relic. Please join us exclusively at the Explorers Hub (discuss.newrelic.com) for questions and support related to this blog post. This blog may contain links to content on third-party sites. By providing such links, New Relic does not adopt, guarantee, approve or endorse the information, views or products available on such sites.
