As head of platform engineering at IGS, I’m focused on how we can enable developers to deliver business value via tooling, infrastructure, and the end-to-end process from inception to release, without the day-to-day overhead of maintaining monitoring and fixing errors. Due to the nature of our product at IGS, vertical growth towers with many different plants, we need a high degree of reliability. If there are outages, our crops can die. We’re also quite a small organization, so we need that insight into the reliability of the system, particularly as we scale and handle and visualize larger volumes of data while keeping costs under control.
When I first joined IGS, we used Application Insights as a native part of Microsoft Azure, but as we use Kubernetes heavily, it wasn’t well integrated with the amount of data we gather. Initially, we looked into open source solutions but we only had three people on the team to manage that, which would have turned into a full-time job in itself. So when we started looking at SaaS solutions, we wanted good adherence to open standards to allow us to do monitoring with logging and tracing. We also wanted something that was Kubernetes-native as that would be our target universal compute run time going forward. A few factors helped us land on New Relic.
Kubernetes approach to monitoring
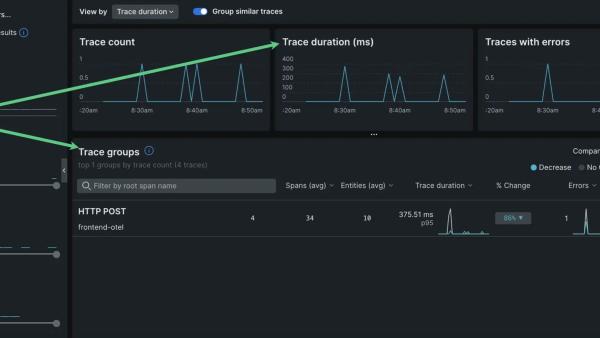
We use Kubernetes quite heavily and are involved in the eBPF community. The way that New Relic has adopted open source, like OpenTelemetry and the integrations with Prometheus, made it a great all-rounder for us. When New Relic acquired Pixie, that got our attention. It’s a very Kubernetes-native approach to monitoring with a developer-centric view of traces. It’s something we were lacking and didn’t even realize when it came to application insights: easily consumed end-to-end tracing.
Speedy instrumentation
The instrumentation phase was really easy. We were expecting a bit of pain to instrument the code manually. Instead, we found that for about 90% of what we were doing, we just needed to add the APM agent into the container. That was it. For more specialized libraries, we had to add a couple of bits of custom instrumentation, but it took almost no time at all. Same for logs. New Relic uses fairly standard approaches for gathering logs for a given language. It was just a case of using our existing logging setup, but adding an additional line for New Relic. We had most of our estate instrumented within about a day and a half.
Reduced cost and developer time
New Relic also had a big, positive impact on our budget and month-to-month spend. We’re at a 58% reduction in spend. It’s freed up a lot of resources and fed directly into our value proposition for customers. Our mean time to recovery (MTTR) has also gone down by 80%. We can identify what’s happened in the code and what the impact is going to be elsewhere. We’ve been able to do proactive monitoring so we can prevent issues before they even occur. We can see where there’s been a performance degradation or an increase in errors that might highlight some underlying instability. Monitoring at scale has become a non-issue for us. We can now focus on the areas that deliver value to our customers and development team, as opposed to keeping people assigned to monitoring.
Features move from code to customer in days, not weeks
The rich New Relic integration ecosystem has also enabled us to streamline our production route. We use Flagger, a tool integrated with New Relic, to act as a quality gate so we can implement a ring-based deployment approach, with promotion across rings being decided by real monitoring data. This allows us to leverage the auto-instrumentation from New Relic, with our per-service health checks and New Relic workloads, and have high confidence in our release process, without the need to create custom tooling. Because of this streamlined delivery approach, we have reduced the time it takes for a feature to move from the first line of code through to customer availability from an average of 22 days to 4 days.
Logs in context
We use multiple environments with lots of microservices with lots of different systems generating logs. The historic way of looking at logs was to get them from the pod directly. There wasn’t a relationship between functionality, the actual part of the business that service was being used by, what the developers viewed it as, and what the infrastructure side viewed as logging. You had logs and you had traces, or logs associated with a service. They weren’t connected. For log management, we had an internal Wiki with hundreds of queries. Whenever you needed to look something up, it was a case of going to the Wiki, finding the obscure query, hoping it works, and if it didn’t, trying to modify it. It was an in-depth process to figure out if someone had already come up with a solution.
With our distributed environment, we use logs quite heavily. A huge benefit of New Relic has been using logs in context. Now we can tie a log to a single trace and see it all together into a single view: here is a service, here’s what it's dependent on, and here are the outputted logs. In New Relic, we can see what the service is, and know how it’s connected to the rest of our estate, and then view the logs for that in the context of its interaction with the other services in our estate—that’s a big part of our success. Now we can go into the application view and drill into the logs from there. It’s a couple of quick clicks, which helps minimize additional cognitive load.
Alerts to improve productivity
We’ve customized our alerts so they are sent to our Microsoft Teams channel. New Relic has the ability to share a link to an alert. It’s a really small capability, but it’s a lifesaver. Every page has a share button. For instance, if we have a specific trace, we can just copy the link, which includes the time window of the trace, and share it in chat. Instead of wasting time with meetings, where someone then needs to load specific data and then try and reproduce their query in order to share it with others, we can now share that data in a couple of seconds.
Terraform for automation
New Relic also has a very rich API with a really strong Terraform provider. At IGS, we have a lot of dynamic environments. We create one for each code change. The ability to use Terraform to create dashboards and workload views and to add any customizations or alerts we need for a given environment means we can have these alerts as part of the code review. Using the same technology in the same languages has been huge. We can write infrastructure code for that in the same way we write for anything else. Then we can have that deployed per environment. It’s made a standardized workflow for us, across both software engineering and the site.
Intelligent Growth Solutions (IGS) grows nutritious and tasty food via automated growth towers. As IGS scales up and brings more data and complexity into operations, they're shifting left to predict issues before they occur by seeing what software performance will look like during development and staging pipelines.
Read more customer stories and sign up for a free account with New Relic to start exploring.
The views expressed on this blog are those of the author and do not necessarily reflect the views of New Relic. Any solutions offered by the author are environment-specific and not part of the commercial solutions or support offered by New Relic. Please join us exclusively at the Explorers Hub (discuss.newrelic.com) for questions and support related to this blog post. This blog may contain links to content on third-party sites. By providing such links, New Relic does not adopt, guarantee, approve or endorse the information, views or products available on such sites.


