
In the fast-paced world of software development, the quest for smoother, more efficient applications feels like a never-ending adventure. But in this adventure, it's not about slaying dragons or uncovering hidden treasures; it's about ensuring your code performs seamlessly and your users are happy.
As a developer, I've faced the challenges of reactive observability, where we typically identify and resolve issues only after they've disrupted our applications. It's a scenario that's all too familiar for many of us. Adding New Relic CodeStream to your tool inventory can help rescue your team from a perilous fate and bring their observability game to a new level.
Picture this: you're deep into a new project, and your code is flowing like water. You're in your element, coding away. But at the back of your mind there's always that nagging concern: Will this code run smoothly in the wild, or are there lurking issues you've yet to uncover?
Enter New Relic CodeStream, a game-changer that's become my trusty companion in the world of software development. What's different about this tool? It's about shifting observability left in your development journey.
Understanding the shift-left approach
Before we dive into how New Relic CodeStream can help you shift left with observability, it's important to understand the concept of shifting left itself. Traditionally, observability has been associated with monitoring and debugging in production. The shift-left approach encourages you to bring observability into the development and testing phases of your software development process. This proactive approach allows you to identify and address performance and reliability issues early in the development cycle, reducing the risk of deploying problematic code.
A game changer for shifting left
New Relic CodeStream is a developer-friendly observability platform designed to seamlessly integrate observability into your existing workflows. It allows developers to collaborate, visualize, and diagnose issues within their preferred development tools.
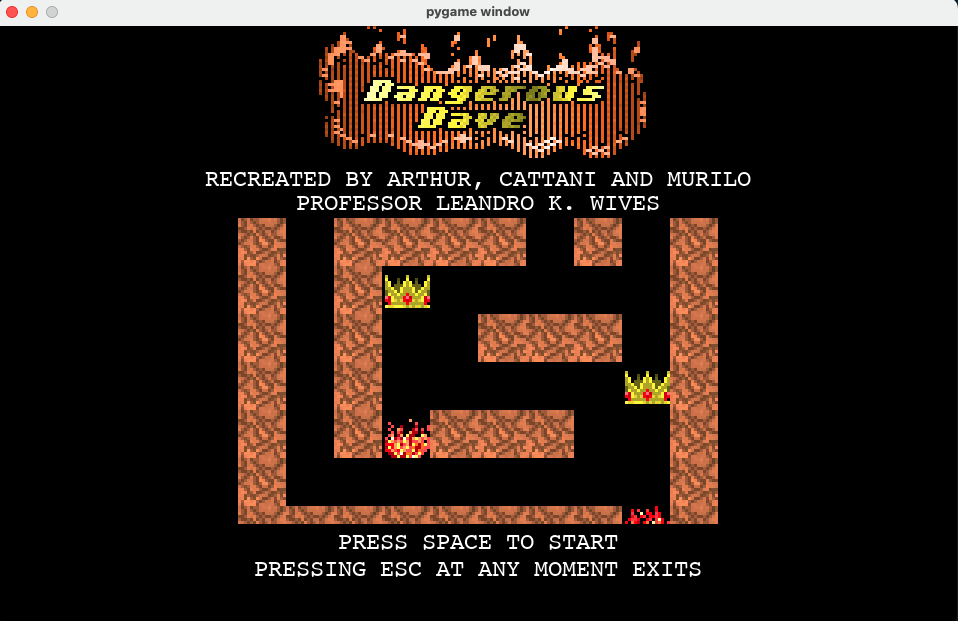
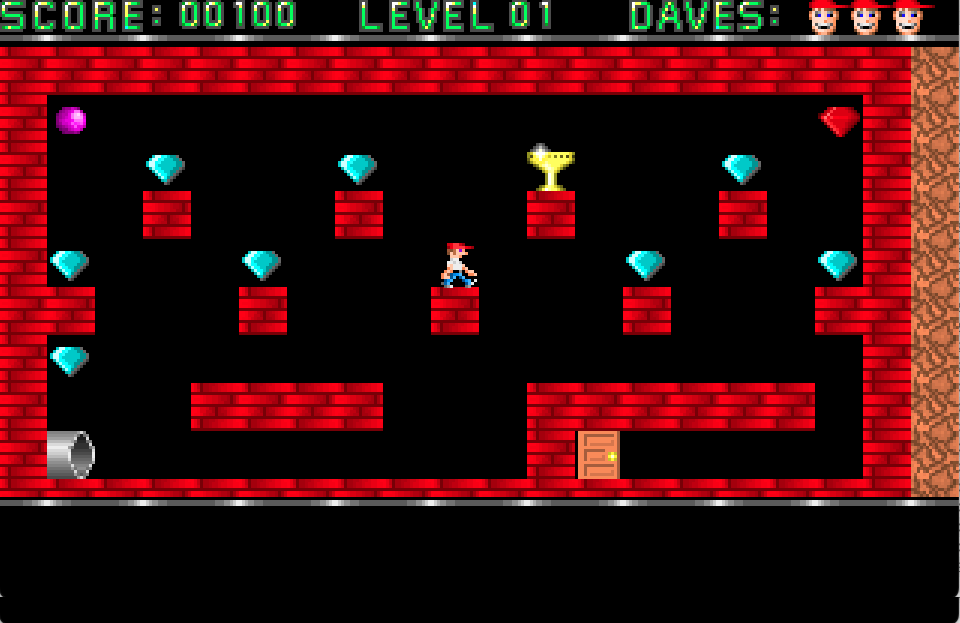
In this blog, I’m using a fork of a replica of the 1988 DOS game Dangerous Dave. This provides a fun way for me to showcase my adventure. And, who doesn’t like to play a good game from time to time. ;-) The purpose of this game is to collect as many items as possible in order to increase my score and finish as many levels as possible.
Here's how you can use CodeStream to shift left with observability:
Collaborative observability
Collaboration is at the heart of this shift-left approach. With CodeStream, I no longer feel like I'm navigating the code wilderness alone. I can discuss, share insights, and even create tasks within my development environment. It's like having a team of fellow adventurers by your side, ready to help you conquer any challenges.
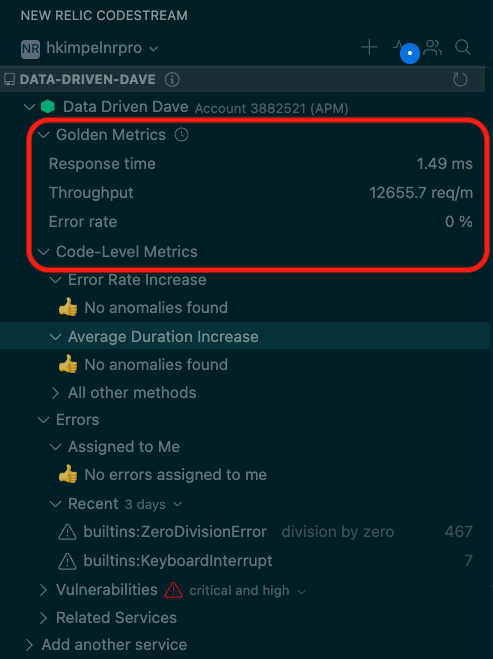
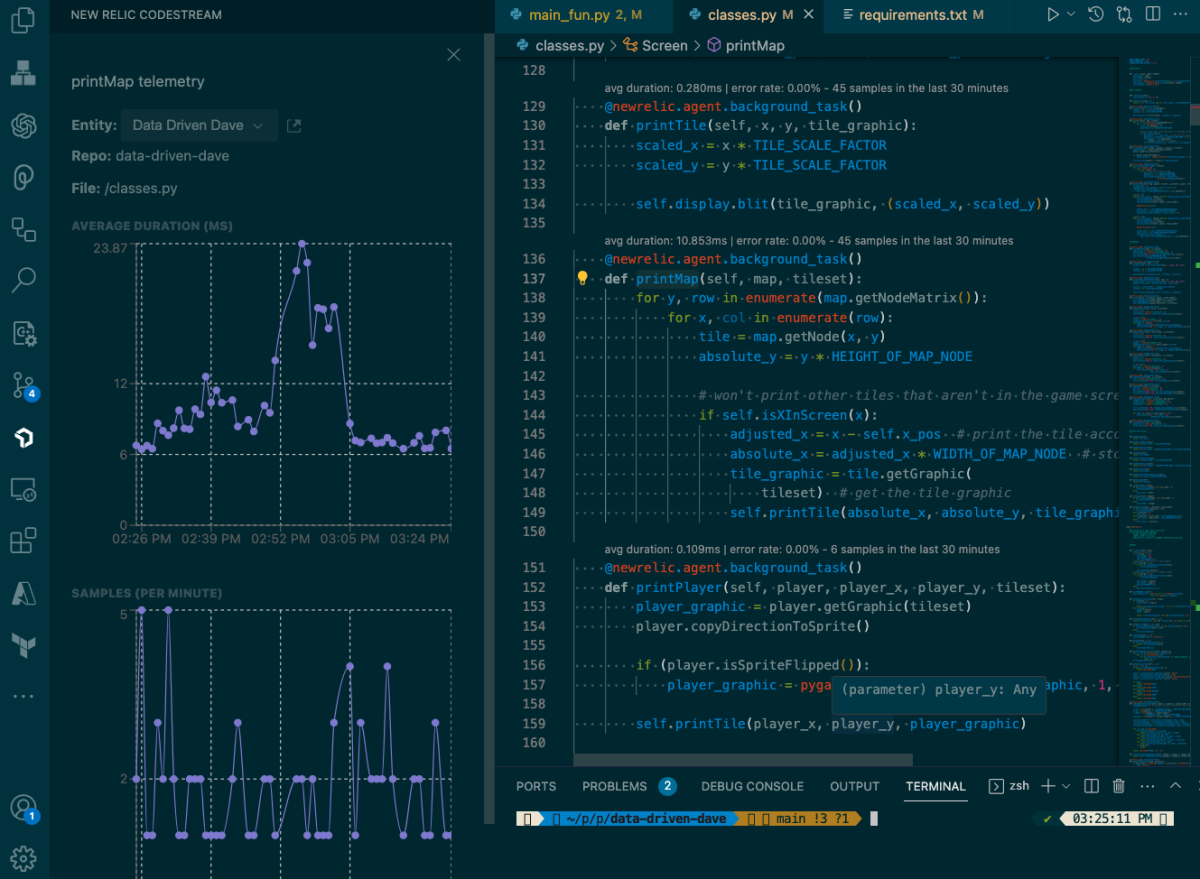
CodeStream does that by providing telemetry data at the service level, including all related services, to present a general snapshot and overview of what I’m currently working on. The ability to drill down and get to the golden signals at the code level provides me with more information to understand and improve my code. This integration of observability into my daily practice right inside my favorite IDE makes me so much more efficient.
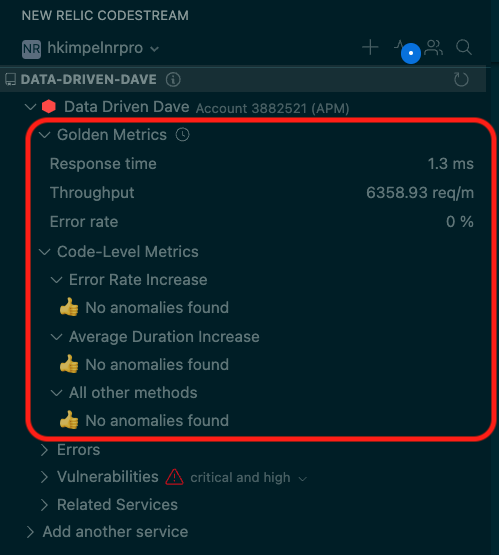
I even have all the high level information at hand for my application in order to make sure that the golden signals for my application look healthy. Being able to get such insights into the IDE allows me to stay focused and not have to switch context from my deep development tasks.
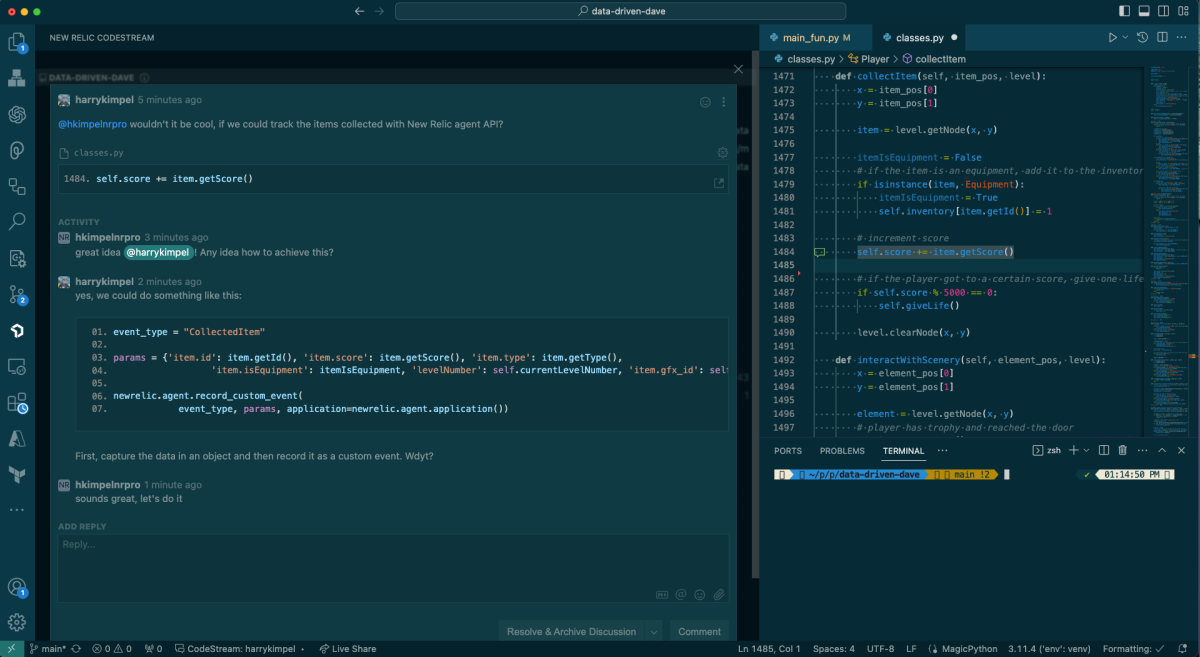
In the example below, I’m discussing with another user an idea on how to improve observability insights into the game. Again, I’m not required to switch to a different tool, make screenshots, or copy and paste code-snippets. I have everything right where it belongs from the perspective of a developer.
Early issue detection
CodeStream surfaces performance metrics next to code to speed up error resolution and streamline planning and implementing performance improvements while simplifying code collaboration.
It’s a huge benefit, because I'm not waiting for issues to show up in production; I'm being alerted as soon as there's a deviation from the expected. It's like having a scout who lets you know when you're veering off course.
In my case—as you can see in the below screenshot—everything looks good and I can happily continue playing my game.
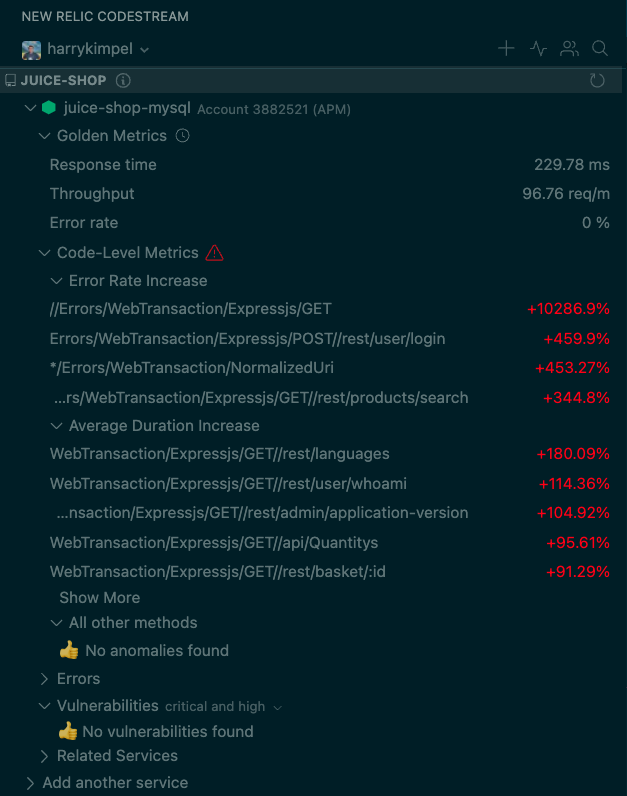
However, in another example (this time from a different application), things have taken a turn for the worse and the road ahead looks perilous. I see some extreme increase in both error rate as well as duration of different transactions within my application. This is an important indicator for me to swarm with my team and run some troubleshooting sessions in order to get this back to normal.
Root cause analysis
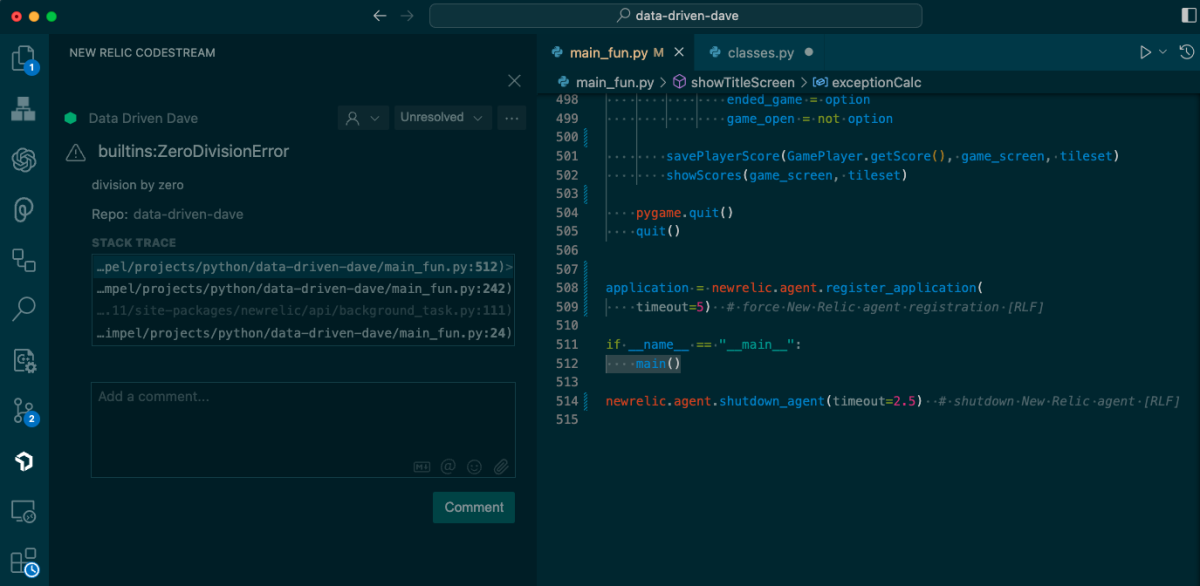
Let’s face it, bugs happen. When the inevitable issue arises, CodeStream has my back with its powerful tools for root cause analysis. I can view information about issues along with the entire stack trace in one unified interface. It's like having a treasure map that guides you to the heart of the issue, saving valuable time and resources. It helps us navigate the complex landscapes of issues efficiently, ensuring that observability is not a distant concept but a part of our entire development journey.
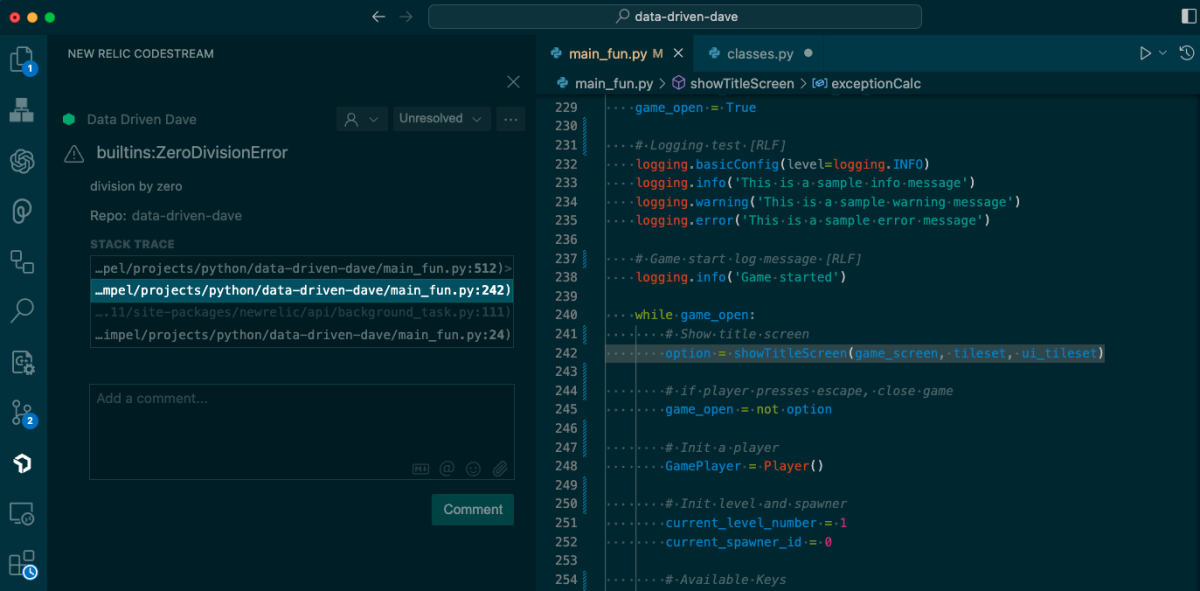
New Relic CodeStream provides an Errors section that easily allows me to look at all the issues assigned to me so that I can keep track of my to-do list. Additionally, I can also look at other more recent errors that occurred.
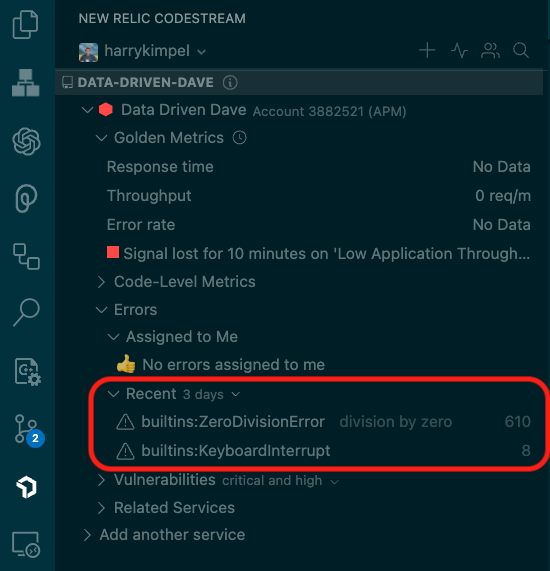
From there I can dive deeper into that ZeroDivisionError seen in the previous screenshot. As you can see in the next screenshot, CodeStream provides all relevant information that I need to get to the root cause of the issue. I can click into the first item in the stacktrace…
And follow through to the next item…
Until I reach the actual line of code where the exception occurred.
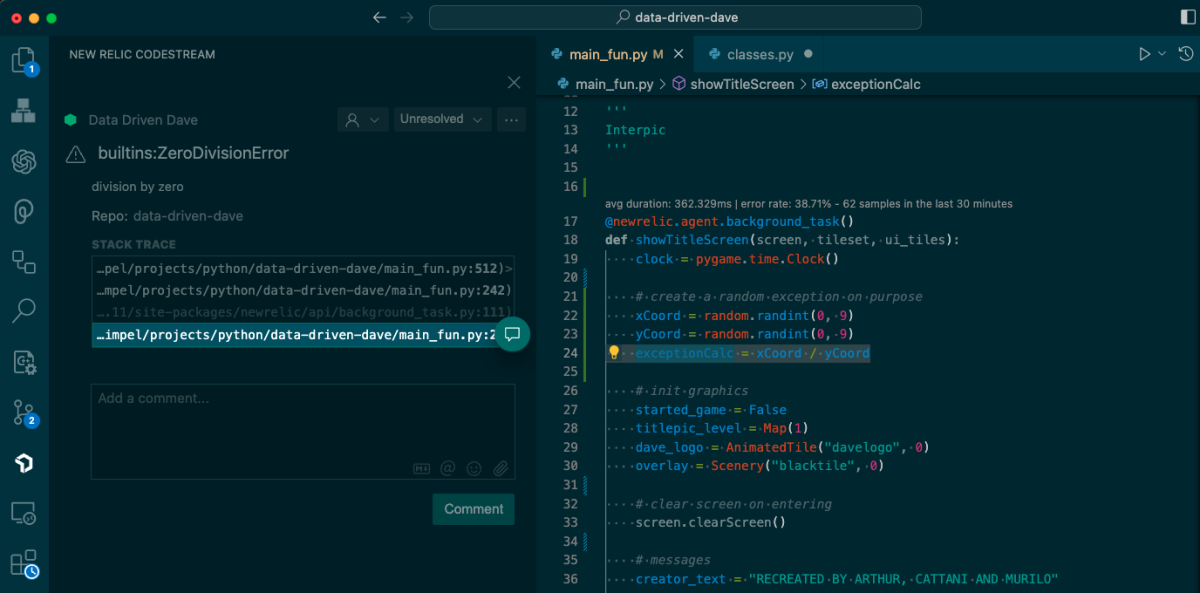
It’s a little like having the cheat codes, right?!
Vulnerability insights at your fingertips
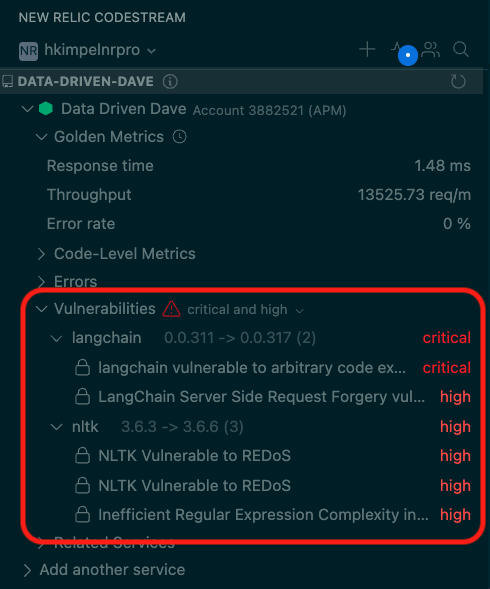
But there's more to this adventure than just performance and reliability. With the New Relic comprehensive platform, you have a vigilant guardian at your side. The New Relic platform is designed to uncover vulnerabilities before they become critical threats. It identifies security issues and provides invaluable insights, all seamlessly integrated into your development environment through New Relic CodeStream.
Imagine having a security wizard working alongside you as you code. The New Relic platform keeps a watchful eye on your codebase, scanning for vulnerabilities and pinpointing security weak points. It's like having a trusted advisor who ensures that your applications are fortified against potential threats.
This integrated approach allows you to stay informed about the latest security threats without ever leaving your preferred integrated development environment (IDE). New Relic CodeStream provides you with the security insights you need to protect your applications, all within the familiar and convenient interface of your development environment.
I can see each of the libraries that are affected by known vulnerabilities.
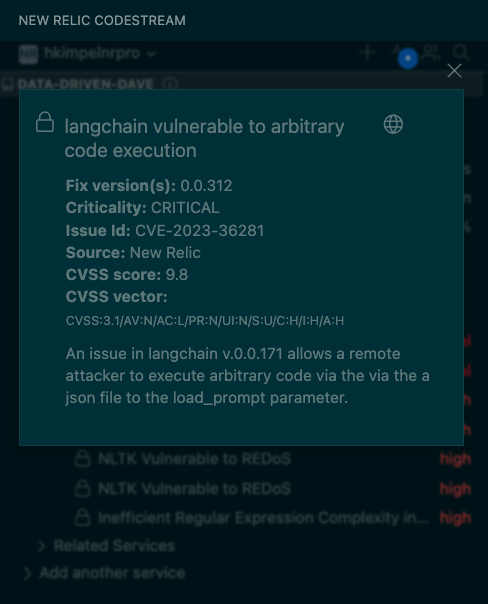
And can even learn more about a single vulnerability right within my IDE.
Seamless integration
One of the things I love about CodeStream is how seamlessly it fits into my existing workflow. It's like adding a new piece to your armor; it doesn't weigh you down, but it provides an extra layer of protection. I can access New Relic data and insights without leaving my development environment, making observability an integral part of my daily routine.
Additionally, I can share data and more information about other tools I use on a daily basis, and, more importantly, that are also used by other team members in my organization. For example, I can easily create comments into messaging tools such as Slack or Microsoft Teams. Or create an issue and share it via any of my favorite tools.
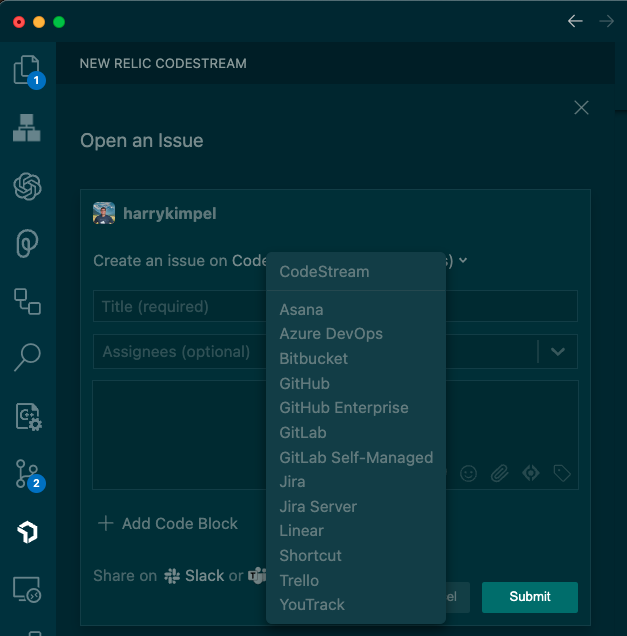
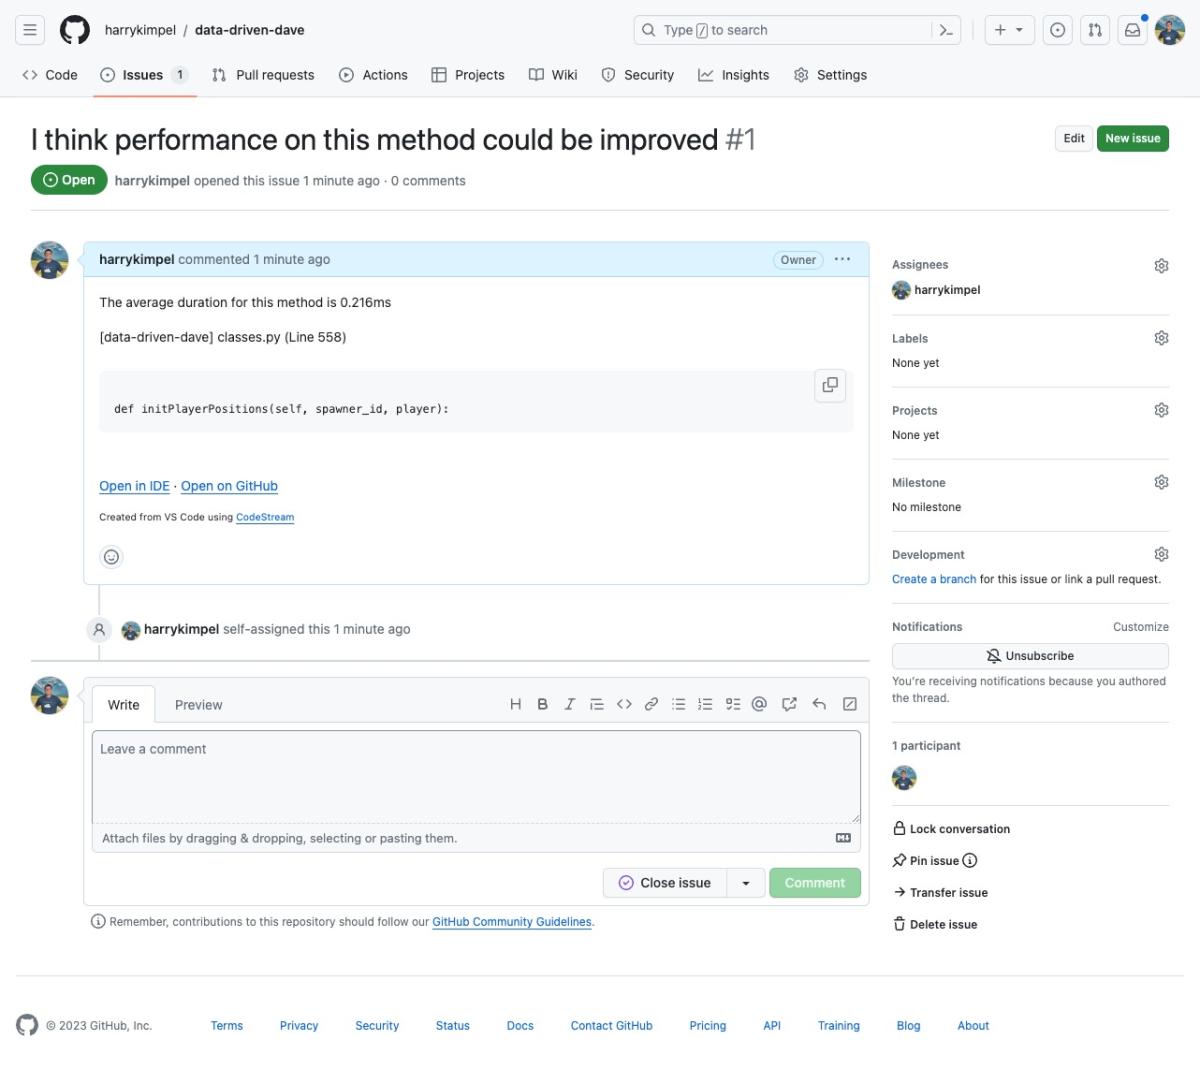
For example, via a GitHub issue.
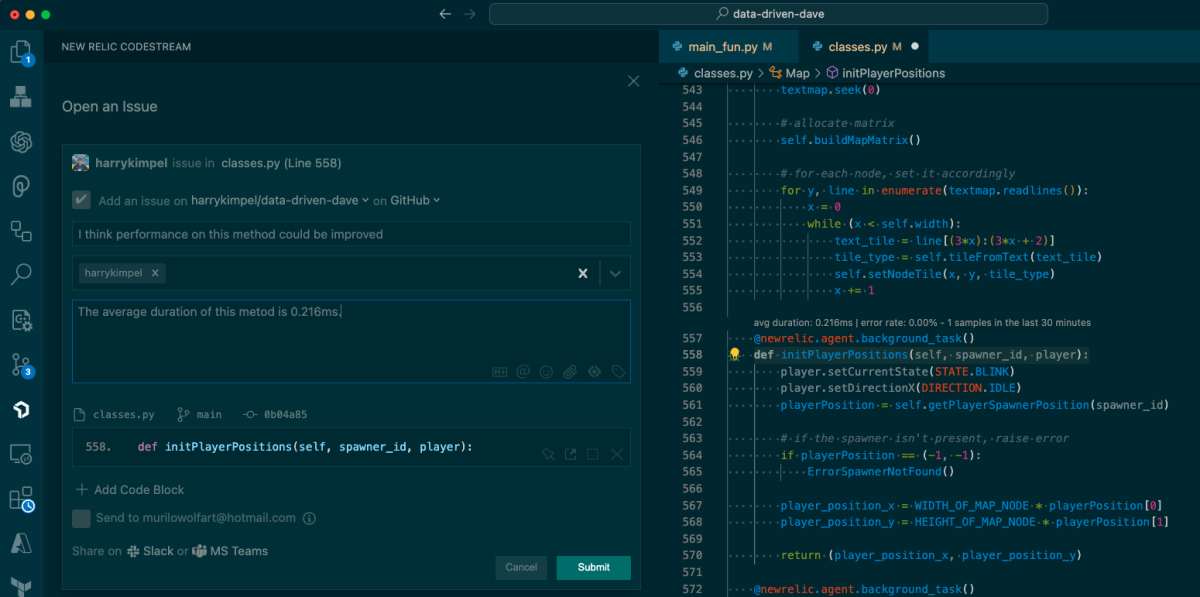
Which I can then review and track as part of my natural workflow in GitHub itself.
The ongoing quest
Shifting left with observability isn't a one-time adventure; it's a continuous quest for improvement. With the New Relic platform and CodeStream, you can not only track your application's performance over time but also bolster its security defenses. It's data-driven decision-making at its best, helping you evolve and adapt your applications to meet the ever-changing user demands while staying one step ahead of potential vulnerabilities.
Conclusion
In the world of software development, where every line of code can make or break an application, the New Relic platform and CodeStream are the beacons that guide us. They're not just tools; they're trusted companions on our journey to create robust, high-performance, and secure applications. So, heed the call, embark on the adventure, and use the New Relic platform and CodeStream to revolutionize your observability and fortify your application's defenses. Your users will be the ones to tell the tales of your legendary, reliable, and secure applications.
Next steps
As you embark on your journey to shift left with observability and embrace the power of New Relic CodeStream, why not experience it firsthand? New Relic offers a free account to get you started on your path to creating high-performance, reliable, and secure applications. Take the first step, sign up for your free account, and witness the transformation of your development process.
Your adventure in the world of observability, performance optimization, and security begins here. With New Relic CodeStream as your trusty companion, you're ready to conquer any challenge that comes your way. Sign up today, and let's make your applications legendary.

The views expressed on this blog are those of the author and do not necessarily reflect the views of New Relic. Any solutions offered by the author are environment-specific and not part of the commercial solutions or support offered by New Relic. Please join us exclusively at the Explorers Hub (discuss.newrelic.com) for questions and support related to this blog post. This blog may contain links to content on third-party sites. By providing such links, New Relic does not adopt, guarantee, approve or endorse the information, views or products available on such sites.


