Hello, New Relic aficionados! Picture this: you're at a bustling local user group meetup, exchanging ideas and sharing tech stories. Amidst the animated discussions and clinking coffee cups, a fellow developer—let’s call him Alex—shares a frustrating puzzle. Alex’s Docker Compose applications are acting like rebellious teenagers, sending their logs to the New Relic Host UI instead of their designated New Relic Container UI. As you dive deeper into the problem, a light bulb goes off. This isn't just Alex's struggle; it’s a common snag affecting many of us in the Docker and New Relic community.
Why do these logs prefer the scenic route, and how can we guide them to their proper home? Inspired by this real-life challenge, I embarked on a quest to demystify the log misdirection issue and share a roadmap to log management nirvana with New Relic. So, grab your digital compasses, dear readers—it's time to navigate through the foggy waters of Docker logging and ensure your data logs exactly where it should.
Understanding the core issue: Where do my container logs end up?
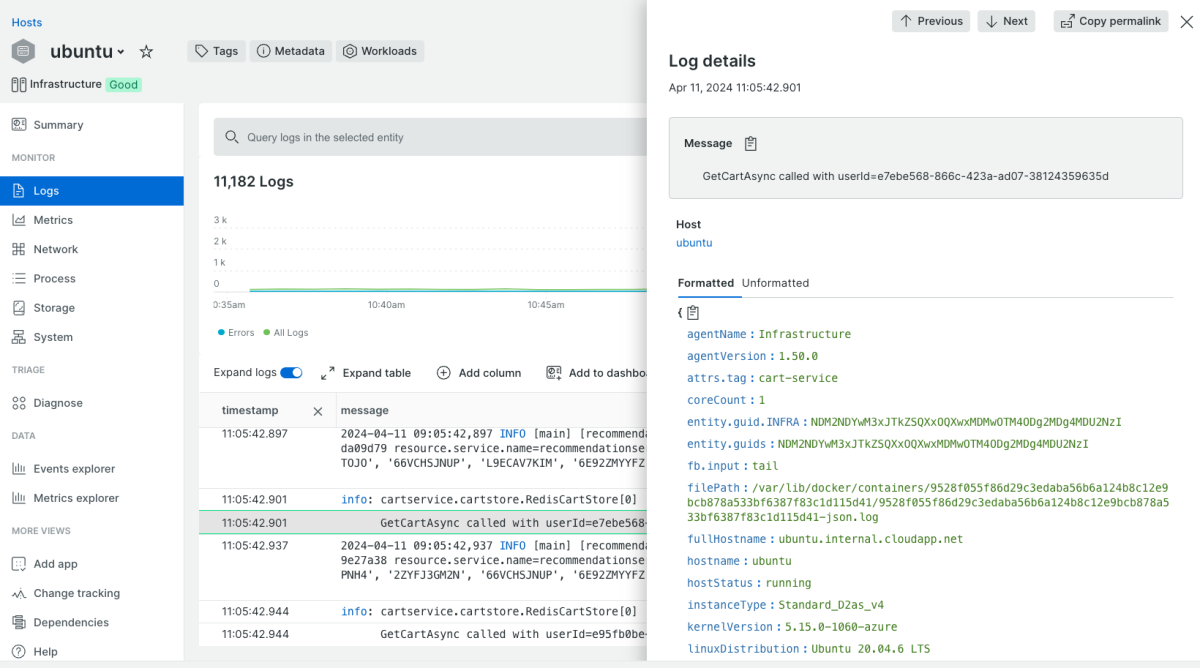
So, what's the fuss about where logs end up anyway? Let's break it down. When you're running applications in containers, especially when using Docker, logging isn't just about keeping a record; it's about clarity and context. The New Relic infrastructure agent (along with the New Relic integration for Docker) is designed to be thorough—it dutifully collects logs from the host and any containers running on it. But here’s the snag: instead of neatly categorizing container logs under each container, all logs get lumped together. Your container logs are showing up right alongside host/server logs in the New Relic infrastructure Hosts UI.
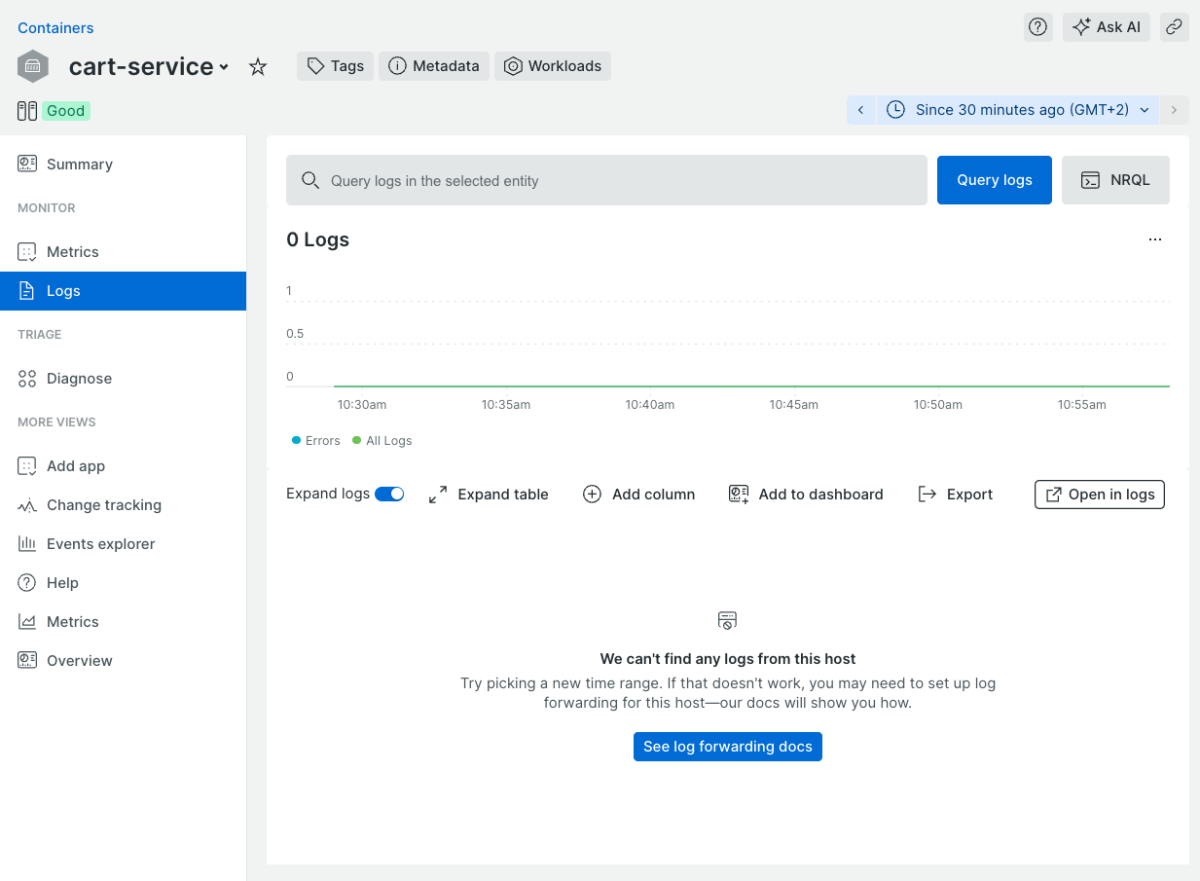
And the Logs section of your Container UI does not show any logs:
Why does this matter? Imagine trying to find a specific conversation in a bustling, crowded room. Every discussion, whether it’s crucial or trivial, merges into one overwhelming cacophony. That's your current logging scenario—container logs are getting lost in the noise of the host logs, making it challenging to pinpoint issues or understand the behavior of specific containers.
This misassignment doesn’t just clutter your view; it complicates monitoring and troubleshooting by obscuring the boundaries between container-specific operations and overall host activity. You need to see your container logs isolated from host logs to quickly diagnose issues, scale effectively, and understand exactly how your containers are performing in the wild.
In the following sections, we'll explore why this log misplacement occurs and how you can reroute your logs to their correct destinations in New Relic, ensuring that your monitoring setup is as sharp and efficient as your development environment.
Configuring your environment for precise log routing
Now that we understand the issue at hand, let's roll up our sleeves and tackle the solution. Organizing your logs with New Relic starts with a few key adjustments in your environment. Here’s a simple guide to ensure your container logs aren’t just collected but correctly associated with their respective container entities in New Relic Logs.
Step 1: Adjust your logging configuration
Chances are, this step might already be in place if you've been monitoring with New Relic. Your goal here is to ensure that the logs from each container are being captured effectively. This involves tweaking your logging configurations to include detailed information about each container's operations. If this isn't set up yet, here's what you typically need to modify in your environment settings to start capturing those logs.
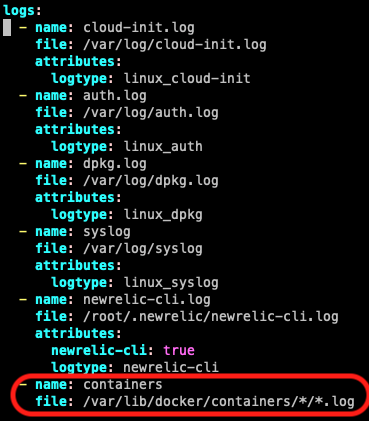
Here’s the snippet that you can copy and use in your logging.yml:
- name: containers
    file: /var/lib/docker/containers/*/*.log
Step 2: Tagging containers in Docker
Next, you’ll need to make your containers recognizable by tags when running your containers manually using ‘docker run’ command or within your Docker Compose configuration file. Adding the below tag makes this happen:
- Docker run command example
docker run --log-opt tag="{{.Name}}" -d log-generator
- Docker Compose example in docker-compose.yml
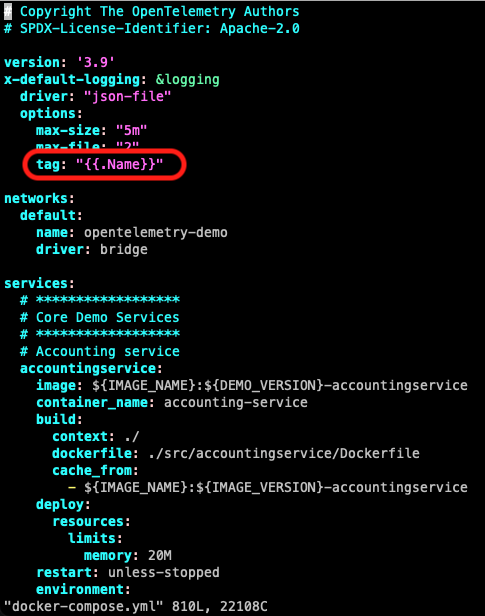
Here’s the snippet that you can copy and use in your docker-compose.yml:
version: '3.9'
x-default-logging: &logging
  driver: "json-file"
  options:
    max-size: "5m"
    max-file: "2"
    tag: "{{.Name}}"
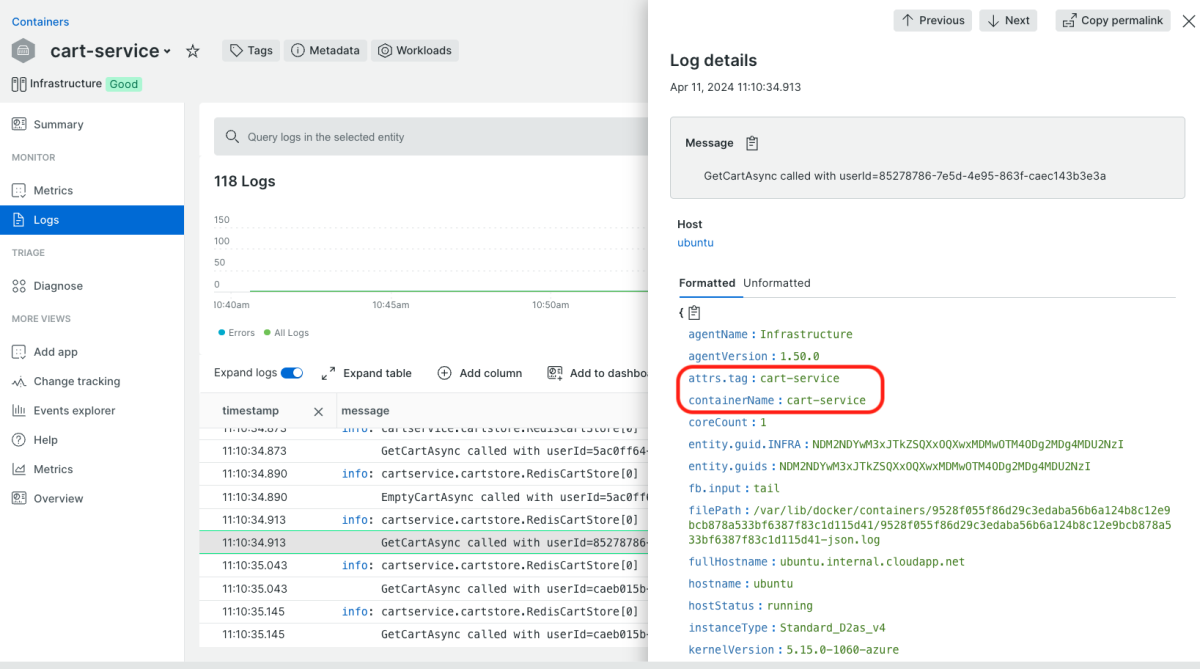
This configuration ensures that each log entry from your containers includes the container's name as a tag, making it easier to track in the logs collected by New Relic.
Step 3: Set up a log parsing rule in New Relic Logs
Once you start seeing the container tags coming through in your New Relic environment, it’s time to refine how these logs are parsed and displayed. Setting up a log parsing rule helps in categorizing and querying logs based on specific attributes.
Here’s how to configure it:
- Name: container name
- Field to parse: attrs.tag
- Filter logs based on New Relic Query Language (NRQL): attrs.tag is not null
- Parsing rule: %{NOTSPACE:containerName}
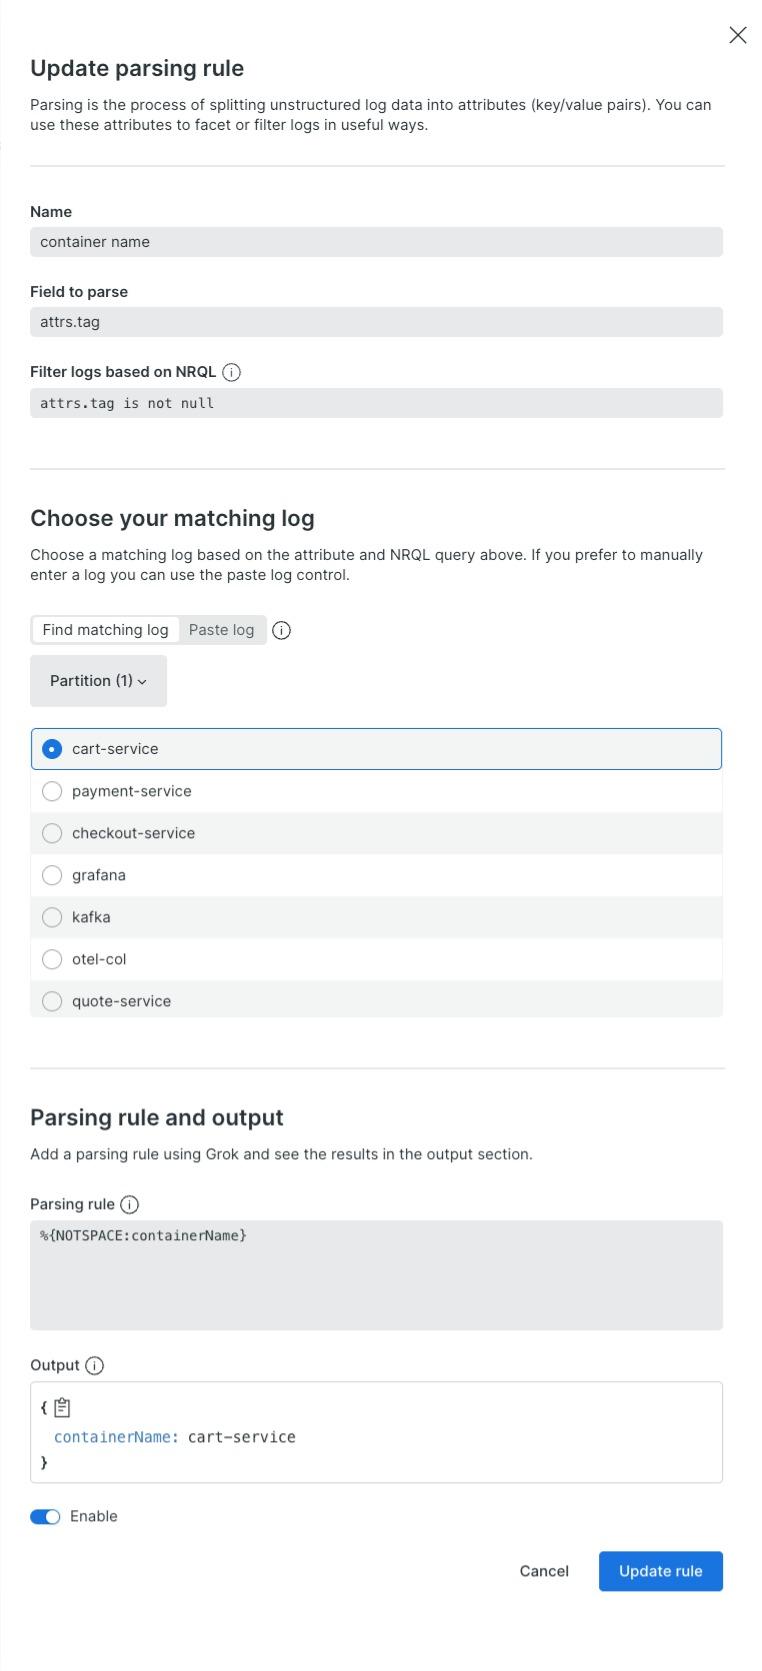
This parsing rule will extract the container name from the attrs.tag field of each log entry and add an additional attribute named containerName, enabling you to filter and analyze logs by specific containers.
Conclusion
With these three steps, your container logs will not only be more organized but also more insightful. By ensuring that each log entry is correctly tagged and parsed, they'll directly feed into New Relic's powerful logging tools, allowing you to monitor and troubleshoot with unmatched precision. This setup not only enhances your ability to respond to issues swiftly but also empowers your team with data-driven insights, ensuring your applications run smoothly and efficiently.
As we wrap up our guide on streamlining Docker logs in New Relic, remember that effective log management is just one piece of the observability puzzle. To further illustrate the power of integrated monitoring tools, I recently contributed to enhancing the OpenTelemetry demo application. My pull request (PR #1495) has been accepted and merged, introducing a new tagging feature that you'll find particularly useful when running the demo with Docker Compose. This addition helps ensure that container logs are easily distinguishable and accurately attributed, enhancing your ability to monitor and troubleshoot effectively. Check out the changes and explore how they can benefit your setup here.
In addition to contributing to the OpenTelemetry demo application, I've also updated the respective sections of the New Relic documentation to reflect these improvements in log management. This update ensures that the strategies and technical details we've discussed are not only tested but also officially integrated into our guidance, making it easier for you to implement and benefit from these changes. You can view these updates (soon) to enhance your understanding and application of these practices, ensuring you get the most out of your New Relic tools.
Next steps
Congratulations on configuring your Docker environment for optimal log management! But the journey doesn’t stop here. Dive deeper into the possibilities:
- Experiment and refine: Adjust the logging levels and parsing rules based on the specific needs of your environment. Each application may have unique insights to offer.
- Monitor the impact: Keep an eye on how these changes enhance your monitoring capabilities. Look for improvements in troubleshooting and system performance.
- Share your insights: Got a handle on things? Don’t keep it to yourself. Share your success stories and challenges in the comments below or on social media. Your experiences could shine a light for fellow developers navigating similar challenges.
- Engage with the community: Join discussions on the New Relic Explorers Hub to connect with other users and exchange tips and tricks. Your feedback not only contributes to community growth but also helps us improve and evolve our solutions.
Ready to elevate your log management game? Start tweaking, sharing, and engaging today. Let’s harness the full potential of precise log data together!

The views expressed on this blog are those of the author and do not necessarily reflect the views of New Relic. Any solutions offered by the author are environment-specific and not part of the commercial solutions or support offered by New Relic. Please join us exclusively at the Explorers Hub (support.newrelic.com) for questions and support related to this blog post. This blog may contain links to content on third-party sites. By providing such links, New Relic does not adopt, guarantee, approve or endorse the information, views or products available on such sites.


