Counting records in a database table seems like it should be a fast task. Since the database software is responsible for inserting and removing records from a table, it should just know how many records there are in the table, right? However, with database tools like MySQL and PostgreSQL, that’s not the case. In this post, you’ll learn some techniques to manually fast count records with these tools.
Counting rows with COUNT(*)
If you have ever used MySQL with the MyISAM engine, the following query is incredibly fast:
SELECT COUNT(*) FROM my_tableThe MyISAM engine maintains a count of all rows in a table, making counts in MySQL/MyISAM spectacularly fast.
However, if you've done counts with InnoDB, another popular MySQL storage engine, or with a PostgreSQL table, then you know a count query takes much longer.
Here's what that query plan, on a PostgreSQL database, looks like for a database with about 4.6 million rows:
QUERY PLAN
------------------------------------------------------------------------------------------------------------------------------------------------------
 Finalize Aggregate  (cost=316766.47..316766.48 rows=1 width=8) (actual time=20100.944..20228.302 rows=1 loops=1)
   ->  Gather  (cost=316766.25..316766.46 rows=2 width=8) (actual time=20089.306..20228.251 rows=3 loops=1)
         Workers Planned: 2
         Workers Launched: 2
         ->  Partial Aggregate  (cost=315766.25..315766.26 rows=1 width=8) (actual time=19903.963..19903.965 rows=1 loops=3)
               ->  Parallel Seq Scan on telemetries  (cost=0.00..310917.40 rows=1939540 width=0) (actual time=29.600..19732.802 rows=1533488 loops=3)
 Planning Time: 1.838 ms
 JIT:
   Functions: 11
   Options: Inlining false, Optimization false, Expressions true, Deforming true
   Timing: Generation 16.348 ms, Inlining 0.000 ms, Optimization 1.648 ms, Emission 51.310 ms, Total 69.305 ms
 Execution Time: 25224.462 ms
(12 rows)2.5 seconds.
That's a long time to wait to get a row count.
Counting rows in MySQL/InnoDB and PostgreSQL
Unlike MySQL/MyISAM, both MySQL/InnoDB and PostgreSQL use Multiversion Concurrency Control for counting. This means the database keeps information about old rows to better support concurrency and rollback features. Essentially, each unique transaction may have slightly different data from other transactions processed at the same time.
Because the state of every table is unique to each transaction with Multiversion Concurrency Control, there cannot be one single true count of rows in the database table like there is with a MySQL/MyISAM table. Consequentially, when one does a count, the database engine has to sequentially scan the table to determine how many rows are in the current transaction's view of reality for that table, at that time.
Count(1) vs Count(*)
As a side note, you may have heard that it's faster to do a count(1) than a count(*), because of the assumption that the * requires the database to access the whole row. That’s not true for PostgreSQL or MySQL and the count(1) version is slightly slower on average.
This is because PostgreSQL has optimized count(*) as a special case that includes no arguments. The count(1) includes an argument and has to check each row to validate that 1 is still not null. That adds a small but measurable overhead, particularly with very large tables.
Counting faster with PostgreSQL and MySQL/InnoDB
Slow counting is problematic if your app needs to know how many rows are in a table, or how many rows a query would return, without actually running the whole query.
Even though the database engines differ, the solutions to this problem for both PostgreSQL and MySQL/InnoDB are similar.
How to count SQL rows faster by leveraging indexes
This basic query for counting is slow with PostgreSQL and MySQL/InnoDB:
SELECT COUNT(*) FROM my_table;There is another way to think about count queries, though. Consider a table with a primary key of id. The above query could also be written as:
SELECT COUNT(*) FROM (SELECT id FROM my_table) AS count;This is functionally equivalent to a basic count query and performs similarly to the basic query with an identical EXPLAIN plan on a PostgreSQL database. There's nothing to be gained there. However, consider a more involved count that is looking for the number of distinct server IDs in a table.
SELECT COUNT(DISTINCT server_id) FROM telemetries;The EXPLAIN plan for this is pretty predictable:
                                                            QUERY PLAN
----------------------------------------------------------------------------------------------------------------------------------
 Aggregate  (cost=349708.21..349708.22 rows=1 width=8) (actual time=13421.207..13421.209 rows=1 loops=1)
   ->  Seq Scan on telemetries  (cost=0.00..338070.97 rows=4654897 width=16) (actual time=23.805..10572.128 rows=4600463 loops=1)
 Planning Time: 0.089 ms
 JIT:
   Functions: 4
   Options: Inlining false, Optimization false, Expressions true, Deforming true
   Timing: Generation 0.454 ms, Inlining 0.000 ms, Optimization 1.151 ms, Emission 21.551 ms, Total 23.156 ms
 Execution Time: 13421.768 ms
(8 rows)This is very slow on this table, which contains about 4.6 million rows. You can see in the above plan the line, Seq Scan on telemetries, which indicates that the database still had to do a sequential scan of the table in order to count those distinct IDs. However, what happens if we rewrite it according to the prior template?
SELECT
  COUNT(*)
FROM (
  SELECT
    DISTINCT ON (server_id) server_id
  FROM
    telemetries
) AS count;
This query returns the same results as the prior example, but consider the plan that the query planner generates for it:
  QUERY PLAN                                 >
--------------------------------------------------------------------------------------------------------------------------------->
 Aggregate  (cost=364483.83..364483.84 rows=1 width=8) (actual time=1315.177..1315.179 rows=1 loops=1)
   ->  Unique  (cost=0.56..364483.68 rows=12 width=16) (actual time=3.273..1315.133 rows=13 loops=1)
         ->  Index Only Scan using telemetries_server_id_data_key_idx on telemetries  (cost=0.56..352846.44 rows=4654897 width=16>
               Heap Fetches: 528435
 Planning Time: 0.121 ms
 JIT:
   Functions: 4
   Options: Inlining false, Optimization false, Expressions true, Deforming true
   Timing: Generation 0.564 ms, Inlining 0.000 ms, Optimization 0.168 ms, Emission 2.680 ms, Total 3.412 ms
 Execution Time: 1315.854 ms
(10 rows)
It is 10 times faster! The magic is in the following line: Index Only Scan using. The database engine was able to determine that it could leverage an index to find all of the distinct IDs. Then it just has to scan that much smaller set in order to count them.
If you need an exact count on a regular basis, you should be doing your query in the most efficient way possible. As the previous example shows, sometimes you can use the EXPLAIN ANALYZE capability of both PostgreSQL and MySQL to help you optimize something so simple as a count. If you can leverage an index to reduce the total number of rows that you are scanning, then you may be able to get an exact count quickly enough.
Sometimes this approach isn’t optimal, though, and other strategies are needed.
How to count ahead of time
If you need to quickly get an exact count, one option is to pay the time cost for this data in small pieces, ahead of time, by using triggers and functions to maintain a MySQL/MyISAM-like count that is kept up to date at all times.
With this approach, you create a table that stores row counts for other tables, then use triggers to update the row count on every insert or delete.
The following PostgreSQL example uses a trigger and a PL/pgSQL function in 3 steps:
1. First, you need to create a table that will store the count:
CREATE TABLE row_count (
  table_name text PRIMARY KEY,
  tally bigint
);
2. Next, create a function that will do the counting:
CREATE OR REPLACE FUNCTION do_count() RETURNS TRIGGER AS $$
  DECLARE
  BEGIN
    IF TG_OP = 'INSERT' THEN
      EXECUTE 'UPDATE row_count set tally = tally + 1 where table = ''' || TG_TABLE_NAME || '''';
      RETURN NEW;
    ELSIF TG_OP = 'DELETE' THEN
      EXECUTE 'UPDATE row_count set tally = tally - 1 where table = ''' || TG_TABLE_NAME || '''';
      RETURN OLD;
    END IF;
  END;
$$
LANGUAGE 'plpgsql';
3. Finally, seed the table will the current count of the table you are counting, and then apply the trigger to your table. Replace my_table in the code snippet with the name of the table you’re counting.
BEGIN;
--- To have accurate counts, the table must be seeded with the current correct numbers.
  INSERT
    INTO row_count (table, tally)
    VALUES (
      'my_table',
      (SELECT count(*) from my_table));

--- And then apply the trigger to my_table.
  CREATE TRIGGER my_table_do_row_count BEFORE INSERT OR DELETE ON my_table
    FOR EACH ROW EXECUTE PROCEDURE do_count();

COMMIT;
Now you can query the current count from the row_count table:
=> select tally from row_count where table_name = 'servers';
 tally
-------
    12
(1 row)
The syntax will be a bit different, but you can apply the same concept to MySQL/InnoDB.
There's a cost for each insert and delete to maintain this count. Amortized over the life of your data, this extra cost will be insignificant if the data doesn't change much, but could add up in a table that has a lot of churn.
Relying on estimates for SQL count
You can also forgo accuracy for speed and rely on estimates.
The PostgreSQL and MySQL/InnoDB engines already maintain estimates of table size. In PostgreSQL, this information is stored in a table called pg_class.In MySQL/InnoDB, it’s stored in a table called information_schema. You can get an estimate of the total table size by querying the appropriate table.
Here's how to estimate count with PostgreSQL:
=> SELECT reltuples::integer
   FROM pg_class
  WHERE relname = 'telemetries';
And here’s how to do the same with MySQL:
=> SELECT table_rows
   FROM information_schema.tables
   WHERE table_name = 'database_name'
   AND table_name = 'table_name';
This count will rarely be accurate, but if a ballpark number is sufficient, this query is very fast.
Other estimate options in MySQL
MySQL has another table called information_schema.innodb_sys_tablestats that also has a num_rows field. Here’s the documentation on this field:
The current estimated number of rows in the table. Updated after each DML operation. The value could be imprecise if uncommitted transactions are inserting into or deleting from the table.
So this is also an estimated number of rows and should return similar results as the previous example.
Other estimate options in PostgreSQL
For PostgreSQL, there is another option. The PostgreSQL query planner keeps an estimate of both the number of rows in a table (the reltuples field of pg_class) and of the size, in pages, of the table (the relpages field of pg_class).
You can query both the current size of the table on disk, in bytes as well as the size in bytes of each block.
If we assume that the estimated number of rows in pg_class divided by the estimated number of pages (blocks) in pg_class provides a relatively accurate number of rows per page of storage, we can then multiply that by the actual number of pages that are in use.
This is calculated by dividing the actual bytes in use by the block size. The number should be more accurate than the PostgreSQL planner's estimate. It's probably easier to understand this as code:
SELECT
  (reltuples / relpages) *
  (pg_relation_size('telemetries') / current_setting('block_size')::integer)
  AS count
FROM
  pg_class
WHERE
  relname = 'telemetries';
This produces a surprisingly accurate estimate of the table size, in rows. This is actually what the PostgreSQL query planner does to produce accurate estimates of row counts.
Estimating row count for arbitrary queries
The previous technique is great for quickly generating a reliable estimate of the row size of an entire table. However, it’s not helpful if you need to estimate the size of the return set of an arbitrary query. Fortunately, there is a similar estimation strategy that can be employed with any query.
When you use the EXPLAIN command to analyze a query, the query planner reports an estimated row count.
A stored procedure can run any other command or procedure, including an EXPLAIN, and it can extract data from what the procedure returns. You can build a count estimator for queries by leveraging the query planner to do the heavy lifting, then scraping the data from it.
Here’s an example that I use in a working product:
CREATE FUNCTION count_estimator(query text) RETURNS bigint AS $$
  DECLARE
    rec record;
    rows bigint;
  BEGIN
    FOR rec IN EXECUTE 'EXPLAIN ' || query LOOP
      rows := substring(rec."QUERY PLAN" FROM ' rows=([[:digit:]]+)');
      EXIT WHEN rows IS NOT NULL;
    END LOOP;
    RETURN rows;
  END;
$$ LANGUAGE plpgsql VOLATILE STRICT;
This iterates over the output of an EXPLAIN, returning the number following the first rows= that it finds in the output, and it’s fast. The query planner usually develops a plan in a fraction of a millisecond, even on slower hardware installations.
So what is the best way to fast count?
If you want an exact count, there's no magic to make it fast. The best you can do is write the most efficient query possible. To understand the most efficient query, you’ll need to clarify your desired outcome.
Pros and cons of an accurate count
If you need an accurate count that’s fast, you can store a combination of procedures and triggers to keep track of the count. This adds operational overhead to inserts and deletes, however, and may make this approach too slow for a busy database.
Pros and cons of estimated counts
The only other option is to accept estimates. There are a variety of approaches, such as querying the same data that the query planner uses to make its estimates, using the query planner, and then scraping, via a stored procedure, the query planner's estimate of row size.
Fast observability with New Relic
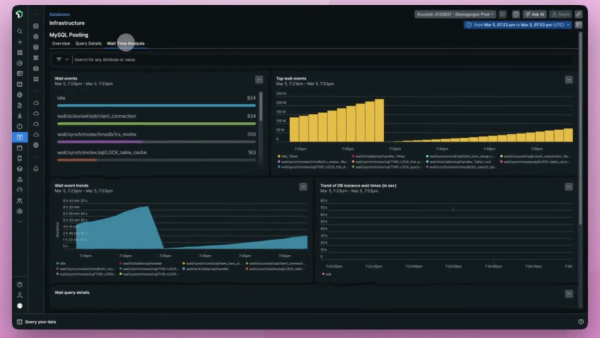
For deeper insights into how your changes to your row-counting strategies and your database as a whole are performing, New Relic offers quickstarts for both PostgreSQL and for MySQL. These quickstarts let you quickly instrument your database, giving you immediate observability of performance, which you can then use for further optimization and troubleshooting.
Next steps
Start monitoring your database performance today with New Relic instant observability quickstarts for PostgreSQL and MySQL.
If you’re not already using New Relic, get started with New Relic for free. Your free account includes 100 GB/month of free data ingest, one free full-access user, and unlimited free basic users.
Join our New Relic Slack community to continue the conversation with hundreds of other developers using New Relic.
The views expressed on this blog are those of the author and do not necessarily reflect the views of New Relic. Any solutions offered by the author are environment-specific and not part of the commercial solutions or support offered by New Relic. Please join us exclusively at the Explorers Hub (discuss.newrelic.com) for questions and support related to this blog post. This blog may contain links to content on third-party sites. By providing such links, New Relic does not adopt, guarantee, approve or endorse the information, views or products available on such sites.


