When we started developing the algorithms behind New Relic Dynamic Baseline Alerts (which uses predictive analytics to let New Relic customers define dynamic, rather than static, alert thresholds), we naturally wanted to try different approaches to determine what would work best. Pretty quickly, though, this forced us to ask the question “How do we know what’s better?”
To answer that, we made two important decisions: we were going to define “better” in the context of helping our customers, and we weren’t going to rely only on human or machine scoring—we were going to use both.
Defining “better”: the Mean Absolute Scaled Error
Essentially, the baselines in baseline alerts are designed to predict the future. That is, the baseline establishes what we expect the metric value to be, and our alerts system compares that predicted value to the actual value to see if it should generate an alert.
Given that goal, we didn’t want to over-optimize for a precise prediction. Instead, we wanted to be able to identify significant deviations from normal behavior. An overly precise prediction might actually predict the sudden change in value, and thus wouldn’t create an alert—and that would defeat the whole purpose of Dynamic Baseline Alerts. We also knew that our method had to be applicable across a wide range of data scales.
We evaluated various statistical error estimators and threw out the ones that didn’t work well across different scales. Our Dynamic Baseline Alerts work with a variety of metrics, from throughput to response time, which can exhibit very different scales. We also threw out some popular formulas that penalize heavily for outliers. We expect outliers, so they wouldn’t be helpful in evaluating our baseline alert algorithms.
The method we settled on is a Mean Absolute Scaled Error, with two baselines-oriented tweaks.
First, rather than evaluate the difference between the prediction and the actual value, we evaluate predictions against anomaly-dampened observations. Since we want to find the best algorithm for Alerts, we want our prediction to be weighted more toward typical behavior than absolute precision. For example, when a system’s throughput suddenly drops to zero, we don’t want to quickly change the baseline to predict zero. Instead, we’d like the baseline to keep “predicting” the normal state of the system, at least for a few hours, so we can show New Relic users that their system is in an abnormal state.
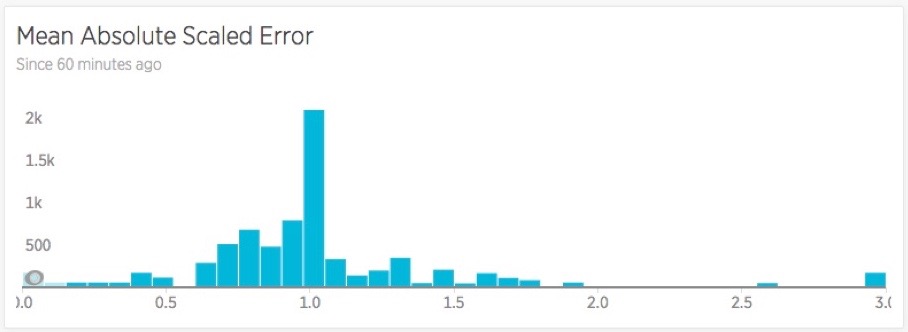
The other tweak we made to the typical Mean Absolute Scaled Error calculation was to put a guardrail around a particular edge case. A fairly constant, easy-to-predict series can display a very large Mean Absolute Scaled Error, simply because the denominator in the equation becomes very small. Since the results for those predictable series are actually great for alerts, we give those results a fixed error of “1.”
This adjusted estimator let us compare different algorithms to see how they perform against real-world time series data. The chart below shows the error distribution for one particular algorithm we were evaluating:
Bucket tests: precision, recall, and F1 scores
The Mean Absolute Scaled Error method lets us analyze our regression error; that is, how well we predict the next point in the time series. But we also want to know our classification error: are we putting data in the right buckets and correctly separating normal behavior from incidents?
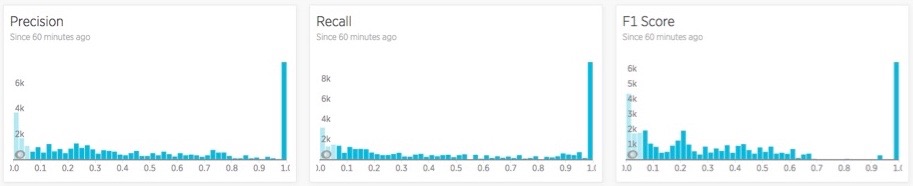
From the machine-learning domain, we pulled a pair of helpful concepts: precision and recall. Precision is a measure of false positives—how often did we trigger an alert for something that wasn’t really a problem? Recall is a measure of false negatives—how often did actual incidents occur that we didn’t catch?
To analyze these concepts, we use the F1 score, which takes the harmonic mean of the precision and recall measurements to give the algorithm that we’re evaluating a single score. Below is an example of the distribution of precision, recall, and F1 scores for one algorithm across thousands of actual metric time series.
The human touch
We used one final test to see how useful our alerts would be on real-world systems: we added humans to the mix to evaluate the fit for purpose. But, being data nerds, New Relic gave our human testers a quantitative scoring system that represented our ultimate quality goals. This rubric is designed to evaluate the ability of a New Relic customer to set up a baseline alert with confidence. For example, if we find a scenario where we cannot configure an alert to catch a noticeable incident, we dock points from that algorithm. By repeating these tests across a consistent set of scorers and baselines, over time we get a sense of our current quality with respect to the past, measure improvements, and detect regression issues.
Dynamic Baseline Alerts is currently in limited release, and is scheduled to be generally available later this year. It’s a great option for alerting on metrics with cyclical patterns, and is designed to help New Relic users answer the question “What’s normal for my system?”
Here at New Relic, we’re having fun doing the math behind the scenes to make it all work. We’ll keep using techniques like these as we work to bring predictive analytics into other parts of the New Relic Digital Intelligence Platform.

The views expressed on this blog are those of the author and do not necessarily reflect the views of New Relic. Any solutions offered by the author are environment-specific and not part of the commercial solutions or support offered by New Relic. Please join us exclusively at the Explorers Hub (discuss.newrelic.com) for questions and support related to this blog post. This blog may contain links to content on third-party sites. By providing such links, New Relic does not adopt, guarantee, approve or endorse the information, views or products available on such sites.


