During the transition of our tech stack from virtual machines to a Google cloud platform five years ago, we picked up a range of open source monitoring tools. The complexity and diversity of tools required quickly became difficult to manage and expensive. At Crisp, we manage thousands of alerts from social media daily and fluctuations are common. Many alerts were based on random threshold values that made sense to the engineer, but culminated in a lot of noise globally. It would take weeks for an engineer to learn how to trace an alert.
To streamline operations, we wanted to move to a single observability tool. At the beginning, we chose an observability provider on the face of their pricing plan. We thought that a price based on hosts was clearer than the data throughput pricing model. After a year, we were still stuck with a number of monitoring tools due to cost limitations. We decided to revisit our strategy, scan the observability tooling market again, and swap to New Relic.
Here's why New Relic was a better fit for us:
A predictable pricing model
With our original observability provider, as soon as we started turning logging and other tools off, we started getting bill shock. We couldn't put our new tool everywhere we wanted—into our dev environments, our staging environments—so we were back to the complexity of logging tools again.
When we moved to New Relic, we needed a solution that would streamline the various apps we were using and provide price predictability. We started by turning previous providers off to create a single pane of glass. At first, we were used to thinking about host-based pricing versus ingest, so that was new for us and scared us a bit. Now we’ve got to understand it, it’s simple and I think that other providers will move to that model or risk getting left behind.
It's very hard to know how much data we're going to put through at one point because we are monitoring social media pages for various clients. Anything could happen in the news and we have to gather that information. With data dropping rules on New Relic, we can manage ingest and maintain predictability of what data gets saved in our observability tooling. We’ve managed to keep our costs flat while improving the return on investment we get from our monitoring tool—with real-time data.
Onboarding engineers in 3 months
With all of our tools, and even when we streamlined with previous providers, it took about 18 months to onboard an engineer fully. With New Relic, we can onboard new agents within six months—that's them fully trained up. We can get them up and running the majority of the observability needs within three months. That means people are getting their time back and we avoid the burnout we used to worry about.
We’ve turned our technical operations team into a center of excellence, with the help of things such as New Relic University and documentation, so that all team members are experts in observability and monitoring best practices. We see team members sign themselves up for courses every month.
New Relic has changed the way we think about and handle alerts. With New Relic, we’ve built alerts into our monitoring strategy. New Relic alerts are then tied into PagerDuty to automate the process for teams. The experience we've had with New Relic is second to none. There's no other partner I've worked with in the past 10 years that has put as much effort in. The individual New Relic team member support, the university resources, the monthly training available, the onboarding, all of it has been unbelievable.
Support on a proof of concept
When we started to design our single pane of glass, New Relic engineers helped every step of the way. When we came to New Relic, our engineer said at our first meeting: "Look, we're going to have to do a technical document for your proof of concept. We want to define your top five metrics hit list: we'll make sure that we hit them, and if we don't, we'll understand why." Immediately, I was on board: someone who got it and wanted to make sure they provided the solutions we needed, and that our dashboards would be ticking the right boxes for our business.
Improving workflows: Improving MTTR 95%
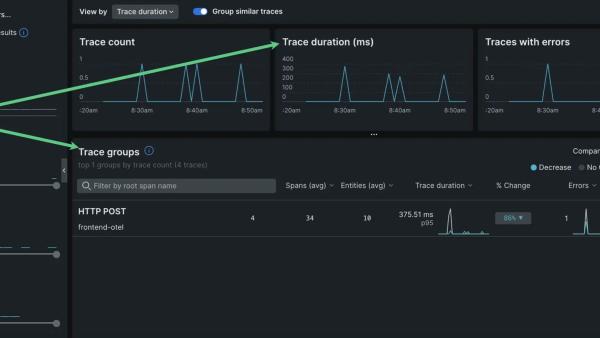
With New Relic, our teams have moved from checking logs first to checking dashboards first as we have real-time data. This allows us to quickly and easily identify the root causes of issues. Our engineers see a graph and instantly understand the impact of a release, or they can understand our service levels in context. Previously, observability was a site reliability engineering team problem. Now, we have business buy-in, everyone's invested in using dashboards as a daily tool. We’re building in SLIs and SLOs that are built into New Relic, into our dashboards.
Our engineers are always using New Relic, they're logged in, asking what is happening and how to maintain our service level objectives. They are moving to an OpenTelemetry mindset. This means that they’re thinking about troubleshooting even before the release gets to staging. A single pane of glass to look at the data enables them to do that.
By consolidating our tools, we have already seen mean time to recovery (MTTR) improve by 95%, from 3 hours to 5-10 minutes with New Relic. We’re also seeing a culture shift in our engineering team. They are fundamentally changing the way they think which is much more aligned to our business role, as a global leader in risk intelligence.
What’s next: BAU ratios and TerraForm
Our next goal is to improve our business-as-usual (BAU) metrics to project-related metrics. With our previous provider, we ended up with engineers focused 80-85% of the time on BAU analysis—a ratio we want to swap to 25% of the time—with the rest dedicated to project monitoring. With New Relic, we are already at 50/50, as our operational systems and automated alerts and tracking mean less troubleshooting or manual observability needed for the daily running of our business and more on double-checking the new features we are rolling out.
Crisp, a Kroll business, is a risk intelligence company that tracks data points across the web and social media to protect clients from online harms as they first emerge. Our work ensures that brands and organizations have platforms that are safe spaces free from bullying, racism, or misogyny free from bad actors.
The views expressed on this blog are those of the author and do not necessarily reflect the views of New Relic. Any solutions offered by the author are environment-specific and not part of the commercial solutions or support offered by New Relic. Please join us exclusively at the Explorers Hub (discuss.newrelic.com) for questions and support related to this blog post. This blog may contain links to content on third-party sites. By providing such links, New Relic does not adopt, guarantee, approve or endorse the information, views or products available on such sites.


