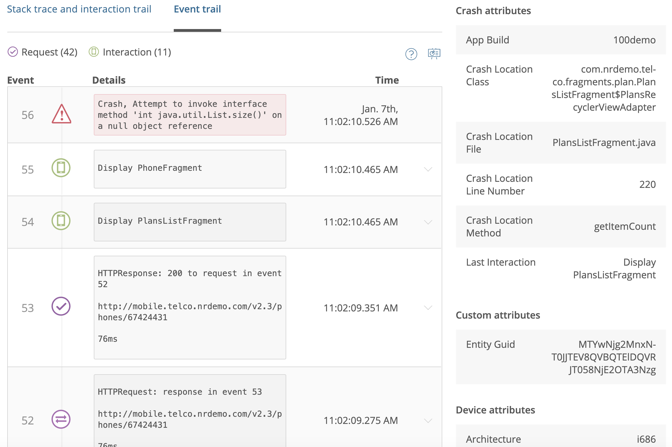
Unlike the crumbs Hansel and Gretel left behind, breadcrumbs in an application can be incredibly useful to mobile app developers looking to build a story about poor performance. Most apps use breadcrumbs as a secondary navigation scheme. Developers also use them to gather specific information at a designated point in their app for crash detection and troubleshooting purposes. But there are plenty of creative ways to use breadcrumbs—from building a story around a specific error to understanding user flow through an app, and there is no end to their utility.
In this post, we’ll explain how to use breadcrumbs to improve the performance of your mobile applications.
Building our own performance story with breadcrumbs
Not too long ago, users of our mobile apps for New Relic and New Relic Insights were creating support tickets and leaving some not-so-great comments in the iOS and Android app stores about the login process for our apps. From “It takes too long to log in” to “I get logged out too frequently,” we recognized we needed to quickly fix this issue, as it was making our apps unusable.
To understand the problem, the Mobile Apps team placed breadcrumbs throughout the login process for both apps. Because both apps have Android and iOS versions, the team made sure to use the same naming convention for their breadcrumbs at each discrete step and stage. This ensured that the team was able to maintain consistency as they investigated the problem spanning both apps—an essential best practice.
Once the breadcrumbs were in place, the team quickly identified the issue—user tokens for their apps were refreshed too frequently. At that point, the team was able to build a performance story and resolve the token issue. In turn, our app store reviews improved, and our support tickets decreased.
So, how can you use breadcrumbs for your own performance stories?
Breadcrumbs and the New Relic Mobile event crash trail
Essentially, breadcrumbs are a trail of clues you leave behind from which you can later build a story when investigating performance issues in your app. Adding breadcrumbs to key workflows, such as your app’s login process or its shopping cart flow, can make troubleshooting much easier after your app is out in the wild.
In New Relic, you can create a mobile breadcrumb custom event using the recordbreadcrumb() API call for either iOS or Android applications.
For example, this bit of code records a mobile breadcrumb event in New Relic:
recordBreadcrumb:(NSString* __nonnull)name attributes:(NSDictionary* __nullable)attributes;


NewRelic.recordBreadcrumb(string $Name, map $eventAttributes)
With mobile breadcrumb events, you’ll be able to correlate information between the session data and your breadcrumbs. For example, if you want to use breadcrumbs to monitor user flow through a particular part of your app, place breadcrumbs in those key areas, and as users hit those areas, you can see that flow within the crash event trail in New Relic Mobile.

The name may be misleading because you can see the progression of the breadcrumbs triggered whether or not a crash occurs.
For example, if the user flow you’re monitoring has users press the login button, then the submit email button, and finally, the begin play button, New Relic Mobile captures each of those steps as the user’s actions trigger each breadcrumb. In fact, we’ve even seen New Relic Mobile users pair their breadcrumbs with timers to determine how long their customers sit on a page before clicking a particular button.
Since New Relic One captures these events, they can be queried in New Relic Insights with the New Relic Query Language (NRQL) or via the New Relic One chart builder to build funnel charts for dashboards.
They may not work in a fairy tale, but they’ll work in app development
If you have an area of your app that you want to improve—or just keep an eye on—leaving breadcrumbs in key spots is a great strategy. Doing so will help you build stories to understand why certain breadcrumbs are never triggered, or why one breadcrumb is triggered more often than others. What you get is insight into what’s happening within the user flow and experience you’ve built into your application.
Breadcrumbs: Don’t get left deep in the woods of mobile app development without them!
Be sure to get the most out of New Relic Mobile.
With 80% or more of your application’s response time on the front end, monitoring client-side performance is critical.
Watch this webinar tutorial and see how using New Relic Browser, Synthetics and Mobile together allows you to create a comprehensive view of your customers’ digital experience.
The views expressed on this blog are those of the author and do not necessarily reflect the views of New Relic. Any solutions offered by the author are environment-specific and not part of the commercial solutions or support offered by New Relic. Please join us exclusively at the Explorers Hub (discuss.newrelic.com) for questions and support related to this blog post. This blog may contain links to content on third-party sites. By providing such links, New Relic does not adopt, guarantee, approve or endorse the information, views or products available on such sites.


