The New Relic Technical Support team has members in our Portland, Dublin, and Tokyo offices, which allows us to have experts available 24x7, 365 days of the year for our customers.
We’re lending our expertise to this blog post in an attempt to answer five of the most common questions we get asked about New Relic APM 360.
If you still have questions about APM after perusing the answers below, please get in touch with our Support experts.
1. Why is my APM agent having network issues?
We often see problems with APM agents being unable to connect to our data collectors. For instance, APM agent logs may show messages such as:
2020-04-28 11:58:21,679 NewRelic ERROR: [pid: 4492, tid: 34] Unable to connect to the New Relic service at collector.newrelic.com:443
Note: Your log syntax may differ depending on the agent language you’re using.
In the same batch of logs you may see a simple network test as running successfully, such as:
NewRelic INFO: [pid: 4492, tid: 34] Connection test to "http://www.google.com" succeeded
Usually, you’ll see this issue if you’re running your app in a locked network, and need to open it to include the New Relic IP range.
To confirm this is the case, try the New Relic Diagnostics tool, which runs in the terminal and will highlight any of the common issues with your apps not reporting data, such as network connectivity problems.
For a full list of network IPs and ports used by New Relic, check out our docs.
2. Why is my APM UI slow?
We’ll cover two possibilities: Metric Grouping Issues (MGIs) and hostname explosions.
MGIs:
A slow APM UI is usually caused by MGIs, which are common occurrences in APM. Most often they come from apps that have auto_transaction_naming set to false.
Auto Transaction naming will group similar metric names together, such as the following:
/user/123/control_panel
/user/456/control_panel
/user/789/control_panel
Is reported to New Relic as:
/user/*/control_panel
Of course, you can add custom attributes to your transaction that collect the specific user ID for a transaction trace. However, from an APM standpoint, the performance of the control_panel transaction as a whole is far more important than an individual user’s performance. If you had thousands of users, each generating a new transaction name as above, your New Relic metrics would very quickly become clouded with unactionable data.
In addition to the data being unactionable, so many metrics reporting to an account can slow the UI. While the UI is building charts for your display, it’s also collating all of the metrics your apps have reported. With metric names adding up to the millions, this can take quite a while and lead to a poor user experience inside the New Relic UI.
So how do you solve MGIs?
Ideally, you want to enable auto transaction naming, so your agents will roll up transactions in a clean way, and you’ll not have to worry about MGIs.
If you do notice a slow APM UI, a first step is to check in on your transaction naming setting in your APM agent’s configuration file.
If auto_transaction_naming is set to false, and you have a valid reason to keep it that way, you’ll need to dig into the app code and re-evaluate how you’re manually naming transactions. For example, our transaction naming protocol doc explains transaction naming for Java apps, but you’ll be able to find specific docs for your particular agent language.
Hostname explosions
Similar to MGIs, hostname explosions can also lead to a slow APM UI.
In modern technology stacks, your application is likely segmented into microservices that are hosted in hundreds or thousands of containers.
Typically, hostname explosions come up in autoscaled environments, where new hosts or new containers are constantly spinning up and reporting to New Relic.
This can be a particularly bad scenario when you try using longer time periods in the New Relic UI. For example, if your environment is cycling through 50 new containers an hour to handle your application, that’s 1,200 containers deployed in 24 hours—or, in New Relic terms, 1,200 hosts the app is reporting from per day. If you look at a seven day period, that’s data from more than 8,000 hosts to parse and display in charts. And that will likely cause occasional timeouts or long load times in the APM UI.
Luckily, the solution is somewhat simple: just ensure you give your containers a common name. Of course, there is great value in identifiable naming conventions for your hosts, and we still encourage you to follow an identifiable naming convention, but rather than using unique IDs in the names for each new container/host, perhaps use something like:
host-prod-eu
or
host-staging-us
Rather than: `Host12-490bff837265c97f’ for example.
Alternatively, you’ll see better UI performance in these scenarios using New Relic One.
3. How do I delete APM applications?
Applications come and go. At some point, you’ll likely need to decommission some of your applications, and our support team is here to help.
So where do you start? First navigate to the Applications index page: https://rpm.newrelic.com/accounts/<accountID>/applications
If your apps have a color-coded “traffic light,” you won’t yet be able to delete those:
You can either disable these APM agents, uninstall them completely, or simply take the hosts offline.
However, if an application starts reporting, or another application begins reporting to the same app name, the UI will reflect that. The application will reappear in the APM UI, and the newly-reporting metrics will be tracked under that application name.
If you bring the relevant host back online, and the application still exists with the agent enabled, it will start reporting to New Relic again.
Once the applications are no longer reporting, their status color in the Application Index page will turn gray. From there you can click through the gear icon to delete the application:
4. What happens if my charts are not loading?
There are three primary reasons charts won’t load in APM:
- Your browser has an extension installed preventing them from loading
- You’re running an unsupported browser version
- New Relic is experiencing a service interruption
If you see a problem with your APM applications—where you see charts with persistent spinning, loading sequences, or just blank backgrounds—your first step should be to disable any browser extensions that could be interfering with New Relic JavaScript. Typically this will be an ad/content blocker such as uBlock, Adblock, and Ghostery.
If after disabling extensions and reloading the APM pages, you still see no chart data, you may be using an unsupported browser.
New Relic supports the most recent versions of major browsers, such as:
If you’ve checked your extension and browser versions, and still see no chart data, there may be an ongoing New Relic service interruption.
Service interruptions are an inevitable part of software development. At New Relic, we have well-tested processes in place to fix service interruptions as quickly as possible while at the same time being as transparent as possible with users. If your chart data is impacted by service interruption, you’ll see that reflected on our status page. If you’re unsure if you’re being impacted by an ongoing issue, don’t hesitate to contact our Support team. We’re here to help.
5. What’s the best way to tailor my Apdex threshold?
Apdex is a measure of user satisfaction, calculated based on transaction response times. The longer the response times, the more frustrated your end users will be.
These calculations are based on a threshold you can set. By default, New Relic APM applications use 0.5 seconds as the threshold. This is suitable in many cases, but not all. So, what’s the best threshold for your application?
Without getting too deep into the math, you can use percentiles to find a good Apdex threshold. You can pick the appropriate percentile based on your desired Apdex score. An Apdex score close to 1.0 is best for your Apdex, but we don’t recommend picking 1.0, as that requires an arbitrarily high threshold value that potentially hides frustrating user experiences.
Instead, you should aim for 0.90-0.92; this gives some headroom for improvement.
With a goal of 0.90, we’ll check against the 80th percentile. (Tip: Our blog post, How to Choose Apdex T: The Final Word, contains a chart that matches the Apdex goal with the appropriate percentile.)
You can do this with a NRQL query:
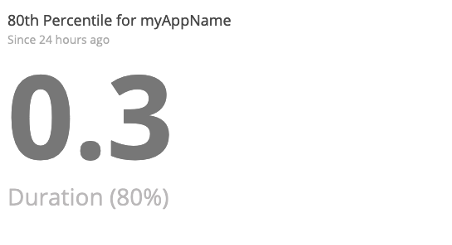
SELECT percentile(duration, 80)FROM Transaction WHERE appName = ‘YourAppName’ SINCE 24 hours ago
Running that query on a demo application returns 0.3, which is the Apdex threshold we should set in myAppName to yield a result of our 0.90 Apdex score.
Plus, you can automate this! Using a script, you can set your desired percentile, and let the script update all of your apps with the best Apdex threshold based on their individual response times.
A caveat with this is that APM transaction traces are collected based on transaction response times in relation to their Apdex threshold. Frustrated transactions (transactions with a response time greater than four times the threshold) are specifically what generate traces.
If you want more traces from transactions, you should lower your threshold. (The goal is to force your Apdex score to suffer for the purpose of generating more traces.)
If you would prefer to maintain the 0.90 score while still generating traces for certain transactions, you can mark those as key transactions, and give them their own individual Apdex threshold.
Want more APM tips?
Hopefully, you've gained a better understanding of some of the most frequently asked questions around APM. But you should also have more knowledge about the complexities and intricacies that you may run into with APM. Of course, this post isn't completely comprehensive.
So, if you still have questions about improving your experience with APM, or anything else New Relic-related that wasn't covered in this blog post, please do contact our Support team and join in the conversation on our Explorers Hub.
And if you're a new APM user looking to improve your knowledge and performance around the product's capabilities, check out our “Guide to Getting Started with New Relic APM.”
The views expressed on this blog are those of the author and do not necessarily reflect the views of New Relic. Any solutions offered by the author are environment-specific and not part of the commercial solutions or support offered by New Relic. Please join us exclusively at the Explorers Hub (discuss.newrelic.com) for questions and support related to this blog post. This blog may contain links to content on third-party sites. By providing such links, New Relic does not adopt, guarantee, approve or endorse the information, views or products available on such sites.


