A modern application is comprised of a complex technology stack. In addition to the app server, the perceived performance of your app is dictated by the performance of databases, caching systems, message queues and the like. Something as simple as a poorly behaving network switch can impact the performance of your end user experience. To track down performance problems, you need performance metrics into each of these technologies. And wouldn’t it be great if you could have visibility into all of them, in an intuitive and consistent way, using a tool you already know and love?
Introducing Platform Plugins
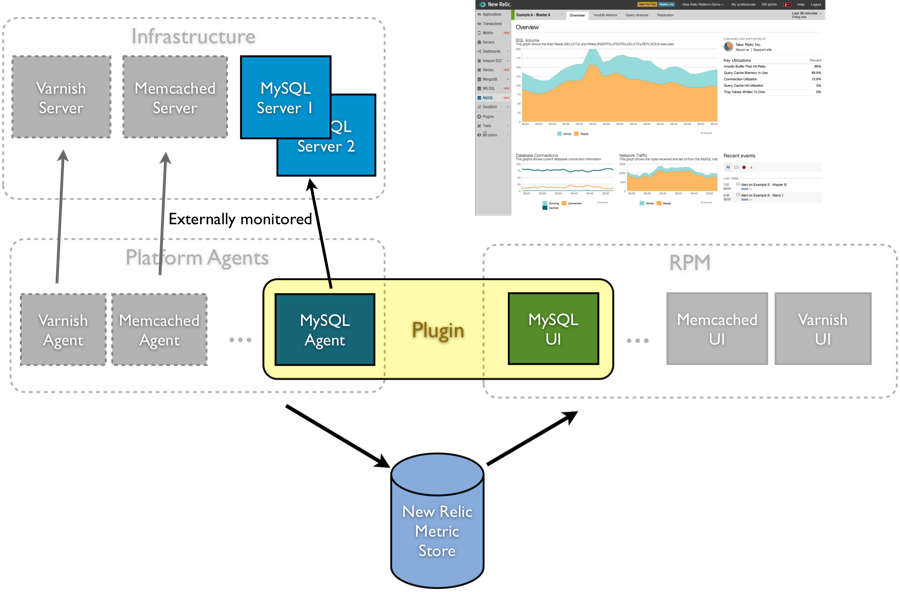
The New Relic Platform addresses this challenge with the new plugin architecture. Plugins provide a way to monitor each of these technologies, extending the New Relic interface with custom-made dashboards specific to each. They pair the reporting of metrics specific to the technology being monitored with a first class visualization of those metrics.
Plugins dramatically expand the possibilities for what you can monitor with New Relic, in a manner that retains all the New Relic goodness you’ve come to expect. Now you’ll have immediate, actionable insight in an easy to use UI for all the technologies you rely on everyday.
A wide variety of plugins are available through New Relic’s Plugin Central, so take a look and see what it has to offer. And if you don’t see one that you need, consider creating one yourself. It’s easy and fun to do.
A Little More About Plugins
Plugins are made up of two parts:
* An agent that observes the system being monitored and reports metrics about that system up to the New Relic data center
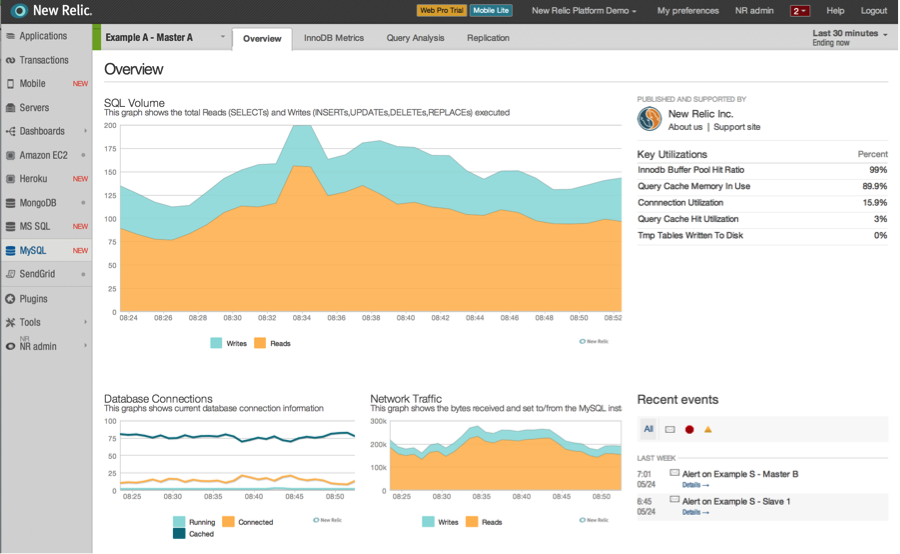
* A matching set of dashboards that display those metrics
Any type of technology – from a database to a caching system or switch – can have an agent written specifically for it. And such an agent will generate metrics that make sense for that technology. Additionally, each type of agent is paired with a UI specific to that agent. So it not only shows those technology specific metrics, it also arranges the information in a way that makes sense to anyone who uses it. For example, the arrangement of dashboards for a database will make sense for those who manage that kind of database and would be significantly different for those of a caching system.
A subset of those metrics is shown in a summary page for a specific plugin and New Relic monitors those metrics continuously. Users can set thresholds for specific metrics based on predefined limits. If a threshold is passed, an alert can be sent via email or any other notification mechanism New Relic supports.
Anything that can provide performance metrics can have a plugin written for it. The only requirement is that it has some kind of API to gather the metrics. Plugins work by polling that API, gathering up the metrics and reporting them up to a New Relic account.
Installing and Running Plugins
There are generally two types of plugins: those written against the Platform SDK that have an on-premise agent running and those written to integrate with a SaaS provider.
For the SDK, the language choices are Java and Ruby. While the install process can vary from plugin to plugin, it’s usually quite simple:
1. Specify the license key for the account that will receive the metrics.
2. Configure the plugin with information about the system it’s monitoring (e.g., the database servers)
3. Run the agent
* For Java, run a single .jar file
* For Ruby, do a bundle install and bundle exec of the gem
Because plugins monitor the systems externally through an API, they have minimal impact on the systems being monitored. For example, if a plugin stopped working for some reason, the system would not be affected. SaaS plugins do not need to be installed and only require a license key for sharing.
Soon after a plugin starts reporting metrics to your New Relic account, you’ll see the plugin appear in the left hand navigation panel in New Relic. (It will also be labeled with the word ‘New’.) From there, you can immediately start exploring the dashboards for that plugin.
Plugin Central
The New Relic Platform is open and extensible. This encourages our community to create a rich variety of plugins. As such, we have plugins written by our partners, our customers and ourselves. There may be multiple plugins for the same technology and all public plugins are available through Plugin Central in New Relic. And each publisher is responsible for supporting and maintaining their plugins.
Developing Plugins
The New Relic Platform provides an SDK that makes it easy to write on-prem plugin agents. It takes care of things like communication with the New Relic data center, running the polling loop, and logging. Plugin authors only need to focus on gathering metrics and calling a simple method to report their relative values.
Our goal is to ensure that the effort required to write a plugin is relative to the effort required to access that technology’s API. If it’s easy to get metrics from it, it will be easy to write an agent for it. From there, the UI is authored using an extension of the New Relic Custom Dashboards feature.
Currently you can choose one of two languages to write your plugins: Java and Ruby. We recommend Java because it typically has the simplest install. You can develop your plugin in whatever IDE you choose and manage it in any repository. (We recommend GitHub.)
In the future, we hope to be able to provide better development and user features by pairing Java and GitHub.
From Agent to UI
So far we’ve said that a plugin is comprised of an agent that reports metrics and a matching UI in New Relic. But how do we know which UI goes with which agent?
Each agent has a specified Globally Unique Identifier (GUID) within it. This is chosen by the plugin author and identifies the plugin forever. We recommend that you construct it from a reverse DNS of your company (i.e. com.mycompany.myplugin).
After your basic agent is written, the next step is to run your agent and start reporting metrics to your account. As we described earlier, you’ll soon see a new entry in New Relic. Its name will be the last segment of your GUID, and an asterisk ‘*’ will appear at the end to signify it’s new and under construction.
From there, you can select the plugin and begin authoring dashboards and specifying summary metrics. These are constructed from the reported metrics.
And that’s it!
Sharing your Plugin
You can create a plugin for your own in-house use. Or you may decide to make it available for the entire New Relic community. The decision is yours.
Publishing the plugin makes it available on Plugin Central for all New Relic account holders to see. It’s a simple matter of filling out some information, such as a description of your plugin and your support links.
Publishing associates the previously chosen GUID with that plugin. When other New Relic users run your agent, we can look up the UI you built and published for the plugin, and instantiate that UI in their account. As they start reporting metrics with your agent to their account, your plugin appears in their left side navigation. And clicking on it shows them their metrics in the UI you published. How cool is that?
Getting Started with the New Relic Platform
The New Relic Platform is designed to make your lives easier and more productive by bringing metrics from other tools into New Relic and expanding your view into key performance metrics across your technology stack. It’s fun and easy. Get started today by visiting our Platform page. And check out what some of our customers are already saying about building and using plugins in our case studies.
The views expressed on this blog are those of the author and do not necessarily reflect the views of New Relic. Any solutions offered by the author are environment-specific and not part of the commercial solutions or support offered by New Relic. Please join us exclusively at the Explorers Hub (discuss.newrelic.com) for questions and support related to this blog post. This blog may contain links to content on third-party sites. By providing such links, New Relic does not adopt, guarantee, approve or endorse the information, views or products available on such sites.


