What is observability readiness?
Your observability readiness is about proactively monitoring key performance indicators (KPIs) critical for your business objectives. To achieve the business objectives, a balance between the coverage and completeness of application monitoring is crucial. Achieving optimal balance helps organizations fix, optimize, and enhance process flows as per end-user experience and demand, resulting in an increase in return on investment (ROI). The New Relic platform perfectly and seamlessly helps businesses achieve their goals.
Why now?
- Client experience is paramount for standing out in a highly competitive marketplace.
- Agile development demands multiple releases—even hundreds—in a short period.
- Abstraction, integration, and complexity of application modernization.
Agile Manifesto:
- Individuals and interactions over processes and tools
- Working software over comprehensive documentation
- Customer collaboration over contract negotiation
- Responding to change over following a plan
Observability readiness should be part of your release cycle or sprint. This helps with:
- The application team to align with dynamic business objectives.
- The DevOps and support team to understand the severity and priority of an issue.
- Businesses to collaborate effectively with teams to achieve their objectives.
In contrast, peak readiness—which is a subset of observability readiness—is important in terms of scaling up your resources vertically or horizontally.
Continuous observability benefits
Each quarter, your business has objectives that align with the yearly goal. Observability needs to align with those objectives and help businesses reach the goal. For example:
- Reduce operational cost: Cloud services and infrastructure continuously cost companies money. System upgrades, deployments, and changes should be monitored to ensure optimal resource utilization.
- Customer satisfaction: Build trust with your customers by understanding how they interact with your application and what the bottlenecks are.
- Employee productivity: Ensure your team is familiar with the observability tool, observability coverage, completeness, and blind spots.
- ROI: Surface business KPIs that matter the most should be correlated with application performance. This helps the application team focus on the critical problem areas.
- Service levels: Track services not performing as expected over a period and that are affecting employee productivity and business KPIs.
New Relic observability readiness process
Let’s look at the observability readiness lifecycle steps.
Business goals
What is the focus of the current year or quarter? Is it to improve uptime, reduce downtime, gain more visibility, or adopt a new business initiative like cloud migration, tool consolidation, embrace OpenTelemetry, and so on?
Observability architecture
Ensuring the observability architecture aligns with the business goals is a critical step. Choosing the New Relic platform gives you freedom in your business goals and architecture decisions. The New Relic platform has an array of features and integrations, and it embraces open source and supports custom apps to fulfill your specific business needs.
Entities monitoring
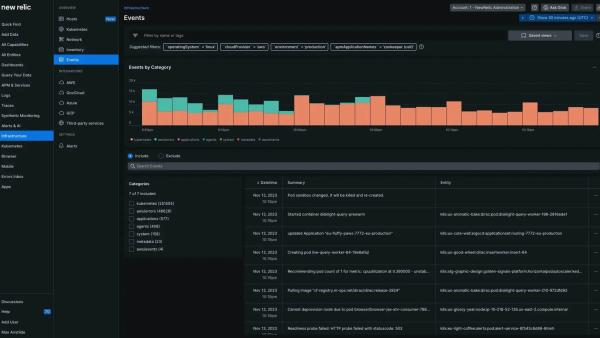
Start monitoring your applications with New Relic, which can provide a real-time report of your entire current estate and also visibility into coverage and completeness of observability.
Identify gaps
It’s not always workable to monitor all your applications, services, infrastructure, and so on. Regardless, the business needs to flourish. This means critical applications should not have blind spots, missing telemetry data, and business data points. This is an opportunity to get creative and find solutions. We’ll visit this point later in the blog post.
Implement and adopt
New Relic integrates with your continuous integration and continuous deployment (CI/CD) and makes implementation easier. Clients have created templates using New Relic Terraform resources, cloud formation, conventions, etc. This paves the way to focus on adoption. The New Relic team and ecosystem partner with you to make this journey smooth.
Measure outcomes
New Relic features like user journey, service level management (SLM), and alert quality management (AQM) help you measure outcomes based on your set objectives.
Repeat
Your observability should continuously grow with your applications and business needs.
Identify gaps: What matters most!
How do we find the gap that matters the most for you?
Remember, “the devil is in the details.” Identifying critical applications, services, and more is straightforward and is a good starting point.
For the next steps, what do we do?
- Interview different personas like developers, users, and customers
- Gather feedback
- Get reports on tickets created last n months
- Perform audits of existing applications
- And so on
The above points are significant, based on evidence and experience. How can we become more efficient and find the gaps? Have you heard of chaos engineering or Game Day or DiRT?
As a recognized approach in software engineering, “Chaos engineering is the discipline of experimenting on a system in order to build confidence in the system's capability to withstand turbulent conditions in production.” (wikipedia)
Perform chaos engineering sessions
Find the troubleshooting shortcomings from the chaos engineering sessions. Chaos engineering is like a Swiss Army knife, as it helps you with:
- Enablement and adoption of the New Relic Platform feature and functionality: Team members involved in these sessions learn from each other. It should be a non-stressful environment where team members can review and share their findings. They understand what’s expected of them, whom to reach out to, and the intricacies of the incident management process.
- Surface your blind spots: Blind spots lead to a higher mean time to resolution (MTTR) and also require specific expertise in the troubleshooting session.
- Telemetry data optimization: Communication between teams, business units, and persona is critical. The chaos session provides an opportunity to see if we have all the required data and information points. For example, the business might ask why sales dropped in the last hour, which could be the result of a changed promotion, an outage in a vendor service, a degraded performance, or some other reason that has nothing to do with the application itself.
- Analyze the cascading effect of performance: A chaos engineering session lets you evaluate and understand coverage and completeness of observability. Without proper coverage, it’s tedious to decide the issue, priority, and severity.
- Bottlenecks: In the early 2000s, if we had an issue we’d generally attribute it to the database or network, and we’d start finger pointing. Today, we have abstraction at its best, be it the cloud, microservices, or infrastructure. Applications are now more inter- and intra-dependent.
We can perform chaos engineering using tools like Gremlin, Chaos Monkey, and Chaos Mesh—or we can do it manually.
Chaos engineering sessions help you determine what’s critical for withstanding turbulent conditions in production. Once you determine what’s essential, the New Relic platform can provide you with coverage gap, recommendations, and missing entities—out of the box and with zero touch.
The New Relic platform: Closing the gap
Your identified gap will vary and can have a wide spectrum. With the New Relic platform you can quickly and organically implement the capabilities you need for observability readiness. Regardless of your preferred troubleshooting approach (log-first or metrics-first), you can leverage New Relic features, such as:
- Logs in context: Logs in context provides a unified view of your logs alongside with other contextual telemetry data points. This ensures no tool switching, no combing through hundreds of lines of logs, and faster root cause analysis.
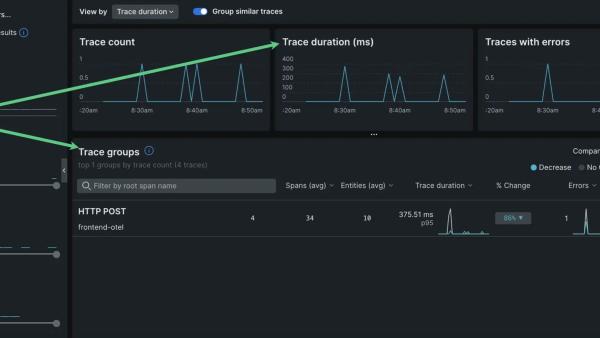
- Distributed traces: Traces provide a thorough analysis of your user's journey so you can identify performance bottlenecks regardless of multiple services involved in the user’s journey.
- Change/deployment tracker: The change/deployment tracker enables you to monitor closely and mitigate issues during and after one of the most important events, “Deployment” or “Go Live,” of the software development lifecycle.
- Security RX: Security RX helps you identify and remediate vulnerabilities in your entire estate, so you can reduce your risk of attack.
- OpenTelemetry: OpenTelemetry is an open standard for collecting and exporting telemetry data, so you can use New Relic to collect data from any application or infrastructure.
- Service level management: SLA/SLM helps you set and track service level agreements (SLAs) and service level objectives (SLOs). This will help you ensure your business objectives are met.
- Workloads: Workloads provide visibility into the performance of your group of services. This can help a team stay focused and keep the lights on.
Implement monitoring best practices as applicable to your particular environment. This will ensure observability coverage and completeness are functioning where they matter the most—and help you control costs.
Summary
Achieving observability readiness is essential for any organization looking to maintain a proactive approach to monitoring and improving their applications and infrastructure. By following the observability readiness process and leveraging the power of the New Relic platform, businesses can ensure their systems are prepared for any challenges and aligned with their goals. Don't wait for a peak season or a critical event; start working towards observability readiness today.
Next steps
Don’t have New Relic? Sign up for a free account here.
The views expressed on this blog are those of the author and do not necessarily reflect the views of New Relic. Any solutions offered by the author are environment-specific and not part of the commercial solutions or support offered by New Relic. Please join us exclusively at the Explorers Hub (discuss.newrelic.com) for questions and support related to this blog post. This blog may contain links to content on third-party sites. By providing such links, New Relic does not adopt, guarantee, approve or endorse the information, views or products available on such sites.


