Python is a popular open source language that’s easy to learn and great for developer productivity. It’s widely used in many industries including web development, scientific computing, data analysis, and artificial intelligence. While Python has many advantages and is used widely in production, it has some disadvantages, too. Because it’s a scripted language, it’s easier for development but not as efficient as languages like Java. To ensure your Python applications are as performant as possible, it’s important to use application performance monitoring tools that can help you optimize your code and fix issues before they impact your customers.
In this article, you’ll learn about the basics of Python monitoring, including:
- Why Python application monitoring is important
- The benefits of monitoring Python applications
- Metrics you should be monitoring in your application
- Tools for measuring application performance
Why Python application monitoring is important
There are many benefits to monitoring Python applications, and these also happen to be benefits of monitoring applications written in other languages as well. Since larger applications often use many tools and programming languages, it’s important to consider these benefits across the board. Whether you’re using Django for an MVC application or Python along with other tools in a larger distributed system, it’s important to understand how monitoring is beneficial for each layer of your application, as well as the kind of monitoring tools you’ll use for each layer.
Presentation layer
The presentation layer includes the user interface and all the parts of your application that a user sees and interacts with. Many issues can occur in the presentation layer, such as pages loading slowly or not loading at all, forms working incorrectly, or components on a page not rendering correctly. If you’re using Django or other frameworks, this could include coding errors in your views.
To monitor the presentation layer, you’ll commonly use real user monitoring (RUM), which monitors real user behavior on your site, and synthetic monitoring, which uses a headless browser to traverse your site.
Business layer
The business layer is where application logic lives. In a monolithic application, the logic might be contained in one codebase, but it’s increasingly common that the business layer consists of loosely coupled microservices that can nonetheless deeply impact each other if something goes wrong. Since many Python applications use JavaScript or JavaScript single page apps (SPAs) like React for the presentation layer, it’s common for a Python business layer to be an API, whether that’s using the Django REST framework or another tool. Issues that can occur in the business layer include failed or slow API calls, problems with customer bank transactions (such as in an e-commerce site), and problems with authentication and authorization services that can prevent your customers from accessing your site, or worse, lead to application vulnerabilities.
For the business layer, you’ll commonly use an APM (application performance monitoring) tool, which gives you important metrics on application performance such as error rate, throughput, and transaction time. You can use the New Relic quickstart for Python to start monitoring the business layer of your Python application in just a few minutes. It comes with a dashboard that gives you data on metrics like transaction time, errors, and CPU usage.
Persistence/database layer
The persistence layer includes interaction with the database such as SQL queries, whether raw SQL or through a tool like Django ORM, while the database layer is the database itself. Issues with the persistence layer can range from inefficient queries to queries that compromise the security of your database. Issues with the database layer itself might include issues with uptime, memory usage, and storage and query speed. New Relic includes quickstarts for many databases, including MySQL and PostgreSQL, which are both commonly used with Django.
Benefits of Python application monitoring
Monitoring Python applications has many general benefits, too, ranging from lower mean time to detection (MTTD) and mean time to resolution (MTTR) to increased developer productivity. Let’s take a look at some of these benefits:
- Identify and diagnose bottlenecks and other performance issues quickly. A performance monitoring tool includes metrics such as throughput, average transaction time, and error rate. You can easily see when topline metrics are affected, then drill down further to find where problems are occurring, such as by looking at the top five slowest transactions. These metrics help you reduce your mean time to detection (MTTD) and mean time to resolution (MTTR) of issues.
- Optimize application performance. Performance monitoring tools aren’t just about pinpointing and fixing issues when they arise. By identifying areas where performance is suboptimal, you can focus your resources on improving sections of your application most in need of optimization. Whether that’s simply trying to ensure pages that end users load quickly or making larger architectural decisions about the scalability of your application, detailed metrics give you important insights into what your teams should be working on.
- Alert on critical metrics and performance indicators. Without alerts, it’s difficult to know when something is going wrong in your application. Too often, this means that you find out about issues from your customers instead of minimizing the impact of problems before your customers are affected.
- Improve developer productivity further. Python is already known as a language that’s great for developer productivity—but every minute you need to spend hunting down bugs and problems in production takes away from time spent coding and developing new features.
- Enable collaboration across teams, including DevOps. While many teams are cross-functional, with larger applications, different teams may be siloed. A good application monitoring tool includes opportunities for collaboration, ranging from alerts that can be sent to multiple teams to in-application debugging and triaging of issues when they arise.
Metrics you should monitor in a Python application
The last section discussed the layers of an application and some of the metrics used for monitoring each layer. Now let’s take a closer look at some of the metrics you should be monitoring in your Python application, what they are, and why they’re important.
A good application monitoring tool will automatically collect these metrics in your application:
- Response time: Response time, sometimes referred to as latency, is an extremely important metric for user satisfaction. Latency is the amount of time it takes for a user request to be fulfilled, and it’s considered one of the four golden signals. A response time of less than a second is considered acceptable (with 200 milliseconds or less being ideal). When the average response time is above a second, your end users are much more likely to be dissatisfied with the performance of your application. This can cause them to stop using the application—and some won’t come back.
You should also set an alert that notifies you when the average response time is too high. Ultimately, the exact threshold depends on your specific use case. A potential starting point is to alert if the median page load time is more than 10 seconds for 5 minutes. This indicates that there are major problems with your website that need to be addressed immediately. If your alert threshold is too ambitious (for instance, set at 1 second), you might get too many alerts, resulting in alert fatigue for your teams.
The next image shows a New Relic dashboard that measures transactions in a Python application, including the average duration and the success rate of transactions. It also highlights both the most popular and the slowest transactions, giving you insights into how specific transactions are performing as well as how your end users are experiencing the application.
- Throughput: Throughput is a measurement of user traffic. One example of throughput is the number of requests per minute. Throughput is an important metric for optimizing your application performance and determining the resources you need to provision for optimal performance. If you are having issues with high latency, information on application throughput is one important data point in terms of solving the problem. Abnormally high throughput can also be a sign of a denial-of-service attack.
- Error rate: The error rate percentage gives you a sense of the number of unhandled exceptions that are occurring in your application. In a perfect world, your application wouldn’t have any errors, but unfortunately, some unhandled exceptions are inevitable. A high error rate indicates that your application has issues that need to be addressed immediately.
- CPU usage: CPU usage is the amount of processing power your application is using. If you’re using too much CPU, your application will not be as performant. Conversely, if you’re using less CPU than expected over time, you may be overprovisioning and you should rightsize your application resources to save on costs.
- Memory usage: High memory usage will cause applications to slow down and potentially crash. Just as with CPU usage, you can use application monitoring to rightsize and optimize memory usage.
- Apdex score: The Apdex score is an open standard solution that’s used to measure how satisfied users are with your application. It measures the ratio of satisfactory response times to unsatisfactory response times and it’s a helpful general indicator of how your application is performing.
In addition to the previous metrics, you may have your own goals and service-level objectives that you want to measure in your application. A performance monitoring tool like New Relic allows you to build custom metrics and dashboards based on queries of your choice.
Distributed tracing with Python
Metrics give you a high-level view of how your application is performing, but what happens when your metrics reveal slow requests or other issues? If it’s a simple request to an API endpoint, you might be able to find the source of the issue with hands-on investigation. But what if the request flows through many different services? In that case, you need more detailed trace information that follows requests through the system. That’s where distributed tracing comes in. Distributed tracing allows you to track requests through your application, giving you powerful insights into how your services are working.
While distributed tracing gives you detailed information about requests in your system, it can involve processing and storing a large amount of data. That’s why it’s common to sample traces, which means tracing only some of the requests flowing through your application. You can trace a percentage of requests (such as 25%) or, if you use tail-based sampling, you can even choose to trace certain kinds of requests, such as all requests that include an error message.
There are many tools you can use for distributed tracing requests in a Python application, ranging from open source tools like OpenTelemetry to all-in-one platforms like New Relic.
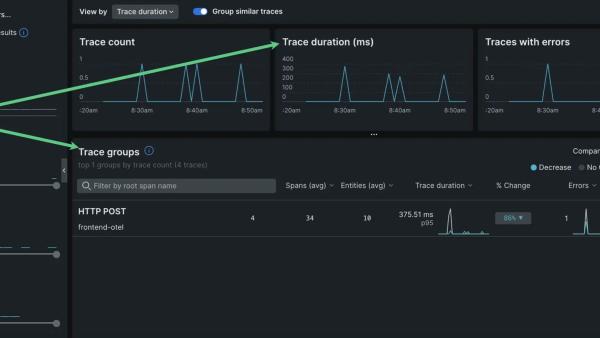
The easiest way to start distributed tracing is with New Relic Infinite Tracing, a fully-managed cloud-based solution that uses tail-based sampling to help you fine-tune exactly which requests you want to trace in your application. The next image shows an example of Infinite Tracing being used to trace and debug a specific transaction.
Tools for monitoring Python applications
Let’s take a look at some open source tools that you can use to monitor your application, then look at some of the benefits of using a consolidated platform like New Relic.
- OpenTelemetry, which is part of the Cloud Native Computing Foundation (CNCF), is a collection of open source tools, APIs, and SDKs for working with telemetry data. You can use it to create, collect, and export your data, including metrics, logs, and traces. Because it’s vendor neutral, you can use it with any language or framework, including Python and Python frameworks. You can easily install the API and SDK packages with pip, then use OpenTelemetry’s tracer to collect data from your application. Because OpenTelemetry is part of the CNCF, it will always be open source, and it benefits from a strong community of developers. However, while you can do automatic instrumentation of your Python applications with OpenTelemetry, setting it up throughout your application will take some manual work.
- Prometheus, which is also a CNCF open source project, collects metrics data by scraping HTTP endpoints and then stores that data in a time series database that uses a multidimensional model. It’s a powerful tool for gathering metrics about your application and it also includes alerting functionality that you can use to notify your teams when issues come up. Prometheus includes a client library for Python.
- Jaeger is an open source distributed tracing tool. It can store trace data in both Cassandra and Elasticsearch.
- Zipkin, which was developed by Twitter, is an open source tool for distributed tracing that can also be used to troubleshoot latency issues in your application. While Zipkin is Java-based, py_zipkin is an implementation for Python.
- logging is a built-in Python library that provides flexible event logging. You can easily import it into your Python application by adding
import loggingto the top of a file where it’s needed. - structlog is an open source Python tool for adding structure to your log messages. You can use it with Python’s built-in logging tool to better organize your logs.
While you can monitor your applications effectively with open source, you will likely need to work with and understand multiple tools. That means custom implementations to fully monitor each part of your application, including server side, client side, cloud-based services, and more. Creating and maintaining a custom full stack observability solution becomes increasingly challenging as your applications scale.
An all-in-one platform like New Relic simplifies monitoring by including automatic instrumentation, built-in visualizations, tools for both real user monitoring and synthetic monitoring, distributed tracing, and more.
Next steps
- Sign up for the free tier of New Relic.
- Start monitoring your Python application in minutes with the New Relic Python monitoring quickstart, which automatically instruments your Python application and provides a dashboard as well as alerts for key metrics.
- Take a deeper dive into the Python documentation.
The views expressed on this blog are those of the author and do not necessarily reflect the views of New Relic. Any solutions offered by the author are environment-specific and not part of the commercial solutions or support offered by New Relic. Please join us exclusively at the Explorers Hub (discuss.newrelic.com) for questions and support related to this blog post. This blog may contain links to content on third-party sites. By providing such links, New Relic does not adopt, guarantee, approve or endorse the information, views or products available on such sites.


