A version of this article originally ran on Diginomica.com.
When talking about the need for observability on cloud platforms—which seems to be happening more and more these days—I'm often asked, "When will this problem be fixed?" People seem to assume that the problems with tracking the state of Kubernetes, serverless functions, or other aspects of today's complex cloud architectures, is related to bugs or blind spots in the tooling. In reality, observability problems are fundamental to the nature of these complex new ways of running software.
A word about the definition of observability; observability isn't a single product, it's not synonymous with logging or metrics, and it's not a simple feature your team can check off. Observability is a measurement of how long on average your team spends trying to understand a problem. If you glance at a dashboard and have an immediate idea what's causing problems, you have great observability. If however, it takes hours to figure out issues—and outages often end with you manually restarting everything—observability is the first problem you should solve.
Because microservices increase the surface area and frequency of software changes, engineers need better visibility to understand the performance of their cloud-native applications and infrastructure. The great benefits of Kubernetes clusters are only available at full capacity to those who maintain real observability. While often portrayed as mutually exclusive, it's possible to make gains in reliability, performance, and efficiency with well-managed Kubernetes, but that requires not only that you know when things are performing poorly, but also when you have underutilized resources.
With these 7 steps to Kubernetes observability, you'll be better prepared to explore, visualize, and troubleshoot your entire Kubernetes environment:
1. Understand the overall health and capacity of your nodes
View application metrics deployed on Kubernetes. Infrastructure monitoring sounds like a somewhat old-fashioned concept but if anything it's more critical on Kubernetes. When analyzing unexpected behaviors and performance issues, the first step for troubleshooting is evaluating your cluster's overall health.
2. Track the dynamic behavior of your cluster, like autoscalingevents
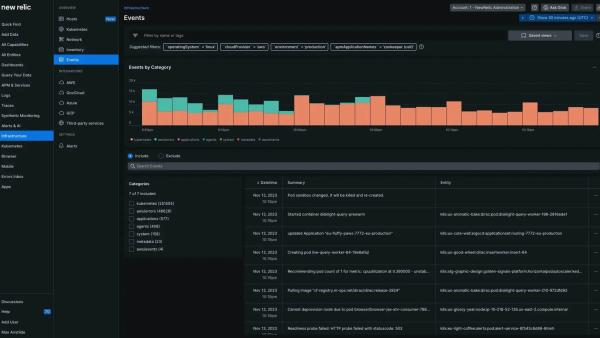
Monitor all Kubernetes events to get useful context about dynamic behaviors including new deployments, autoscaling and health checks. The control plane of Kubernetes determines the real-world performance of your cluster so tracking dynamic events are a critical component. You must track API server stats, etcd, and scheduler to know what's going on with your cluster as a whole.
3. Correlate log data from all services running on Kubernetes
See logs for your clusters in the context of your broader environment to speed troubleshooting. When exploring a critical issue, many developers find themselves moving from logs, to monitoring of overall metrics, over to a tracing tool. Not only does this result in a scattered user experience, it can be very difficult to correlate this data. Put simply: when we see a spike in reaction time metrics, it can be hard to find logging from the slowest responses or connect distributed traces with relevant logging. Open-source observability tools like OpenTelemetry are actively working to develop ‘logs in context' to connect logging data with other monitoring tools.
These connections allow engineers to correlate causes—seeing what incident triggered a certain behavior. See point 5 for an exploration of seeing behaviors that, while not necessarily causally linked, are at least correlated in time.
4. Understand how your microservices communicate with each other
Communication between the nodes and pods within a cluster is often harder to track than behavior within a single node. Link Kubernetes metadata and get performance and distributed traces of your applications, whether instrumented via New Relic agents, open source tools like Prometheus, StatsD or Zipkin, or standards like OpenTelemetry deployed in Kubernetes clusters. This gives you insight into error rates, transaction times and throughput so you can better understand their performance.
5. Understand service performance through integrated telemetry data
When asked to define "observability" I often use the shorthand, "Observability is how quickly you can understand problems with your system." By that definition, it's clear that the speed with which you can read metrics from a dashboard has a direct impact on observability. Put simply all monitoring has a user experience, and the better that user experience for your engineers, the more quickly they can understand and resolve problems.
6. Correlate performance information with business intelligence
Tracking the value of particular customers, their parent organization, or their usage level of your product may not seem like critical data to have during an outage; but business intelligence can be the key to figuring out a problem. No system, no matter how well architected, successfully treats all users equally, so patterns like parent organization or user geography can reveal patterns that weren't obvious any other way. This can also help root out some false alarms: during one of the last outages I worked, repeated alarms for errors in the user experience were quickly resolved when we realized the user in question was a contractor working for us and experimenting with different unsupported requests to our API.
7. Track requests from source to destination
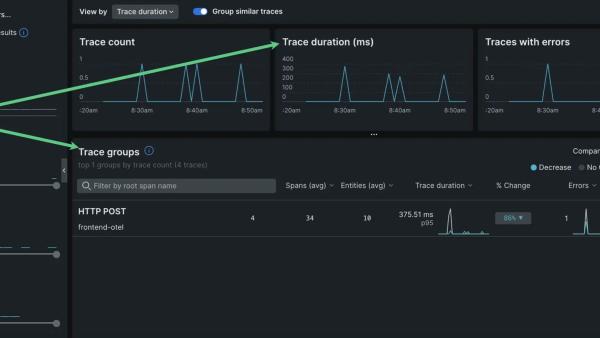
Distributed tracing has grown to be a tool that most engineers expect to have available while researching problems. In an ideal world you'd see every request start in a front end or mobile app and move through your entire system. In reality even the best systems must do sampling and don't always cover every step of a request's path. Still distributed tracing, the measurement of timing information from all parts of your stack, is incredibly useful when chasing an intermittent bug or trying to improve performance.
It's critical that any solution lets you view your Prometheus monitoring data alongside telemetry data from other sources for unified visibility, and remove the overhead of managing storage and availability of Prometheus so you can focus on deploying and scaling your software.
In a competitive technology marketplace, Kubernetes is a path to differentiation on uptime, performance, and efficiency. If you wish to deliver better performance than your competitors, an efficiently orchestrated cluster is one of the ways you'll get there. To reach these performance goals you must maintain consistent insight into how your cluster is really performing. This is especially critical for maintaining efficiency, since close monitoring will help show you when you have excess capacity that can be more efficiently put to use.
Get on the path to exploring, visualizing, and troubleshooting your entire Kubernetes environment by signing up for New Relic One for free.
The views expressed on this blog are those of the author and do not necessarily reflect the views of New Relic. Any solutions offered by the author are environment-specific and not part of the commercial solutions or support offered by New Relic. Please join us exclusively at the Explorers Hub (discuss.newrelic.com) for questions and support related to this blog post. This blog may contain links to content on third-party sites. By providing such links, New Relic does not adopt, guarantee, approve or endorse the information, views or products available on such sites.


