OpenTelemetry (OTel) offers a standardized approach to collecting and exporting telemetry data, making it an essential tool for modern application monitoring. When combined with New Relic—the powerful Intelligent Observability Platform—you can harness the full potential of your OpenTelemetry data for insights and optimization.
In this blog post, we'll walk you through the process of querying OpenTelemetry data in New Relic using New Relic Query Language (NRQL). By the end of this post, you'll have a clear understanding of how OpenTelemetry data is stored in the New Relic database (NRDB) and how to maximize its utility for your applications.
The code used in this blog post is available here.
Understanding OpenTelemetry data types
Before we dive into the query process, it's essential to grasp the foundational elements of OpenTelemetry data. OpenTelemetry utilizes different metric data models to capture various types of telemetry information. These include:
- Counter: Represents cumulative, non-decreasing values, such as the number of requests handled or total exceptions processed.
- Up down counter: Tracks values that can increase or decrease over time, like the number of active database connections.
- Histogram: Provides aggregated measurements, such as count, sum, min, and max. This is useful for app server response times.
- Observable counter: Similar to counter but allows for asynchronous telemetry reporting via callbacks. This is ideal for process metrics like CPU time.
Storing and Querying OpenTelemetry data with New Relic
A recommended pre-read for this blog post would be a good understanding of the three different metric data models associated with OpenTelemetry. At a high level, there are four steps in this process:
1. Instruments are created using OpenTelemetry instrumentation code.
2. The OpenTelemetry SDK transforms it into OpenTelemetry Protocol (OTLP) data format for transmission.
3. The transmitted data is then stored in a datastore (in this case, NRDB).
4. Use NRQL to query the OpenTelemetry data stored in NRDB.
Table-1 below shows the mapping of data types between instruments vs. OTLP vs. datastore.
At Origin (in Code) | In Transit (OTLP) | At Rest (New Relic) |
Cumulative monotonic sum | Count* | |
Cumulative non-monotonic sum | Gauge | |
Histogram | Distribution | |
Cumulative monotonic sum | Count* |
* Note: Counter and observable counter data types are translated to the Count data type in New relic if the below environment variable is set to delta. If the environment variable is not set, then it is translated to CumulativeCount in New Relic.
set OTEL_EXPORTER_OTLP_METRICS_TEMPORALITY_PREFERENCE=deltaLet's delve into each data type and explore how to instrument, store, and query them in New Relic.
Prerequisites
Before you can instrument, store, and query the data types discussed in this blog post, the following are required:
- Using your favorite IDE, create a file named app.py.
- Install these three dependencies:
- pip install opentelemetry-api
- pip install opentelemetry-sdk
- pip install opentelemetry-exporter-otlp-proto-http
- Add the following environment variables:
export OTEL_SERVICE_NAME=MyPythonService
export OTEL_EXPORTER_OTLP_ENDPOINT=https://otlp.nr-data.net
export OTEL_EXPORTER_OTLP_HEADERS=api-key=<New Relic Ingest License Key>
export OTEL_ATTRIBUTE_VALUE_LENGTH_LIMIT=4095
export OTEL_EXPORTER_OTLP_COMPRESSION=gzip
export OTEL_EXPORTER_OTLP_PROTOCOL=http/protobuf
export OTEL_EXPORTER_OTLP_METRICS_TEMPORALITY_PREFERENCE=delta
export OTEL_RESOURCE_ATTRIBUTES=service.instance.id=123- Add the following code to app.py:
from opentelemetry import metrics
from opentelemetry.sdk.metrics import MeterProvider
from opentelemetry.exporter.otlp.proto.http.metric_exporter import OTLPMetricExporter
from opentelemetry.sdk.metrics.export import PeriodicExportingMetricReader
from opentelemetry.metrics import CallbackOptions, Observation
from typing import Iterable

metric_reader = PeriodicExportingMetricReader(OTLPMetricExporter(), export_interval_millis=5000) # harvest cycle every 5 seconds)
provider = MeterProvider(metric_readers=[metric_reader])

# Sets the global default meter provider
metrics.set_meter_provider(provider)

# Creates a meter from the global meter provider
meter = metrics.get_meter("my.meter.name")
Counter
Description: These are additive non-decreasing values.
Mapping:
At Origin (in Code) | In Transit (OTLP) | At Rest (New Relic) |
Counter | Cumulative monotonic sum | Count |
Here are a few examples of cumulative monotonic sum:
- Number of requests handled
- Total number of exceptions handled
- Network bytes sent
Step 1: Instrumentation with OpenTelemetry
To create a counter in Python: This code snippet creates an instrument called mycounter.increments. It then sends three values of the instrument to the OTLP end point. Since the harvest cycle is set to once every five seconds (in the earlier step), introducing the sleep time ensures that three harvest cycles occur.
my_counter = meter.create_counter("mycounter.increments")
# Sleeping for 10 seconds to ensure 1 value is sent per 5 second harvest cycle
my_counter.add(3)
time.sleep(10)
my_counter.add(5)
time.sleep(10)
my_counter.add(10)
Step 2: Storage in NRDB
Upon reaching New Relic, the OpenTelemetry data is stored in NRDB. Table-2 below shows how the counter origin value is stored in New Relic. The OpenTelemetry harvest cycle in this example is five seconds. New Relic ingests the OpenTelemetry cumulative value and stores both the delta value in NRDB.
Harvest Cycle | Origin Values | OLTP Value | New Relic Value |
1 | 3 | 3 | 3 |
2 | 5 | 8 | 5 |
3 | 10 | 18 | 10 |
Please note: If you want to store the delta values and cumulative in NRDB, UNSET this environment variable:
unset OTEL_EXPORTER_OTLP_METRICS_TEMPORALITY_PREFERENCEStep 3: Querying with NRQL
Now comes the exciting part—querying your data using NRQL. NRQL is a powerful query language designed for flexibility and precision in data analysis.
The following is a query to see how the data is stored in NRDB. Run the below NRQL:
SELECT * FROM Metric WHERE entity.name = 'MyPythonService' AND metricName = 'mycounter.increments' SINCE 15 MINUTES AGO
The above screenshot shows that the data type is set to Count.
To view the sum of mycounter.increments metric values for a given time period, you can run:
SELECT sum(mycounter.increments)
FROM Metric
WHERE metricName = 'mycounter.increments'
SINCE 15 minutes ago UNTIL now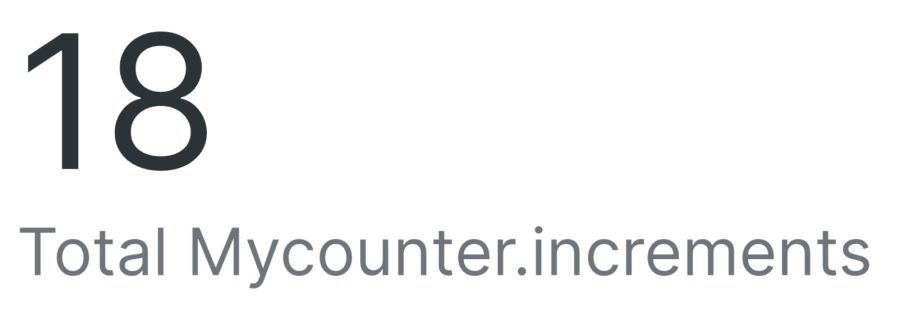
For more advanced insights, you can analyze the rate of change over time using the TIMESERIES function in NRQL:
SELECT rate(sum(mycounter.increments), 1 minute) FROM Metric WHERE entity.name = 'MyPythonService' AND metricName = `mycounter.increments` SINCE 15 MINUTES AGO TIMESERIESThis query provides a timeseries of your metric's rate of change, enabling trend analysis and performance monitoring.

Up down counter
Description: Values that could go up or down over time.
Mapping:
At Origin (in Code) | In Transit (OTLP) | At Rest (New Relic) |
Up down counter | Cumulative non-monotonic sum | Gauge |
Here are a couple of examples of up down Counter:
- Number of database connections
- Size of cache
Step 1: Instrumentation with OpenTelemetry
To create an up-down counter in Python:
# Create the up down counter instrument
my_updown_counter = meter.create_up_down_counter("my_updown_counter")

# Sleeping for 10 seconds to ensure 1 value per 5 second harvest cycle
my_updown_counter.add(3)
time.sleep(10)
my_updown_counter.add(-1)
time.sleep(10)
my_updown_counter.add(10)
Step 2: Storage in NRDB
Table-3 below shows how the OpenTelemetry data type is mapped to the gauge data type in New Relic. The harvest cycle period is configured to be five seconds.
Harvest Cycle | Origin Values | OTLP Value | New Relic Value |
1 | 3 | 3 | 3 |
2 | -1 | 2 | 2 |
3 | 10 | 12 | 12 |
Step 3: Querying with NRQL
To see all the myupdowncounter metric values using NRQL (note that the data type is gauge):
SELECT * FROM Metric WHERE entity.name = 'MyPythonService' AND metricName = 'myupdowncounter' SINCE 15 MINUTES AGO
To see the latest value in the myupdowncounter metric values for a given time period, use the latest keyword. You could similarly use the keywords sum, min, and max, as shown in the screenshot above.
SELECT latest(myupdowncounter) FROM Metric WHERE entity.name = 'MyPythonService' AND metricName = 'myupdowncounter' SINCE 15 MINUTES AGO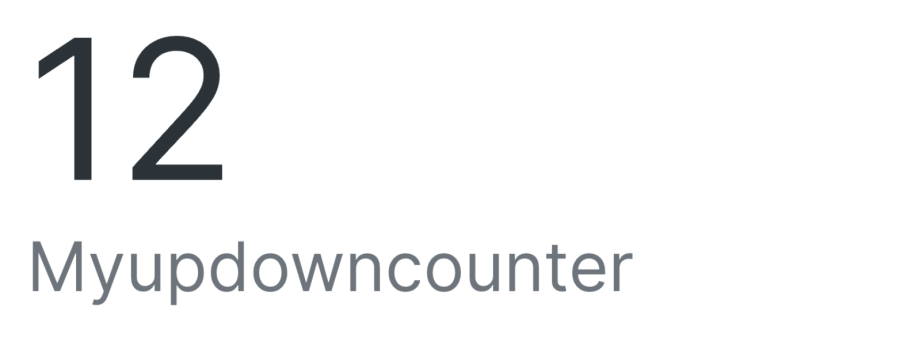
Histogram
Description: One metric that provides multiple aggregated measurements like count, sum, min, and max.
Mapping:
At Origin (in Code) | In Transit (OTLP) | At Rest (New Relic) |
Histogram | Histogram | Distribution |
Here’s an example of a histogram:
- App server response times
Step 1: Instrumentation with OpenTelemetry
Important: This environment variable needs to be set for histograms:
set OTEL_EXPORTER_OTLP_METRICS_TEMPORALITY_PREFERENCE=deltaTo create a histogram in Python:
# Create the histogram instrument
my_histogram = meter.create_histogram("myhistogram")

# Record histogram values. This will create a histogram with 9 values/count.
for i in range(1, 10):
    latency  = random.randint(1, 1000)
    my_histogram.record(latency, attributes={"attr1": "value1"})
Step 2: Querying with NRQL
To see all histogram metric values using NRQL:
SELECT * FROM Metric WHERE metricName = 'myhistogram' SINCE 5 minutes AGO
To see only the sum of the histogram metric values using NRQL (in this case, the chart type has been set to JSON):
SELECT sum(myhistogram) FROM Metric WHERE metricName = 'myhistogram' SINCE 5 minutes AGO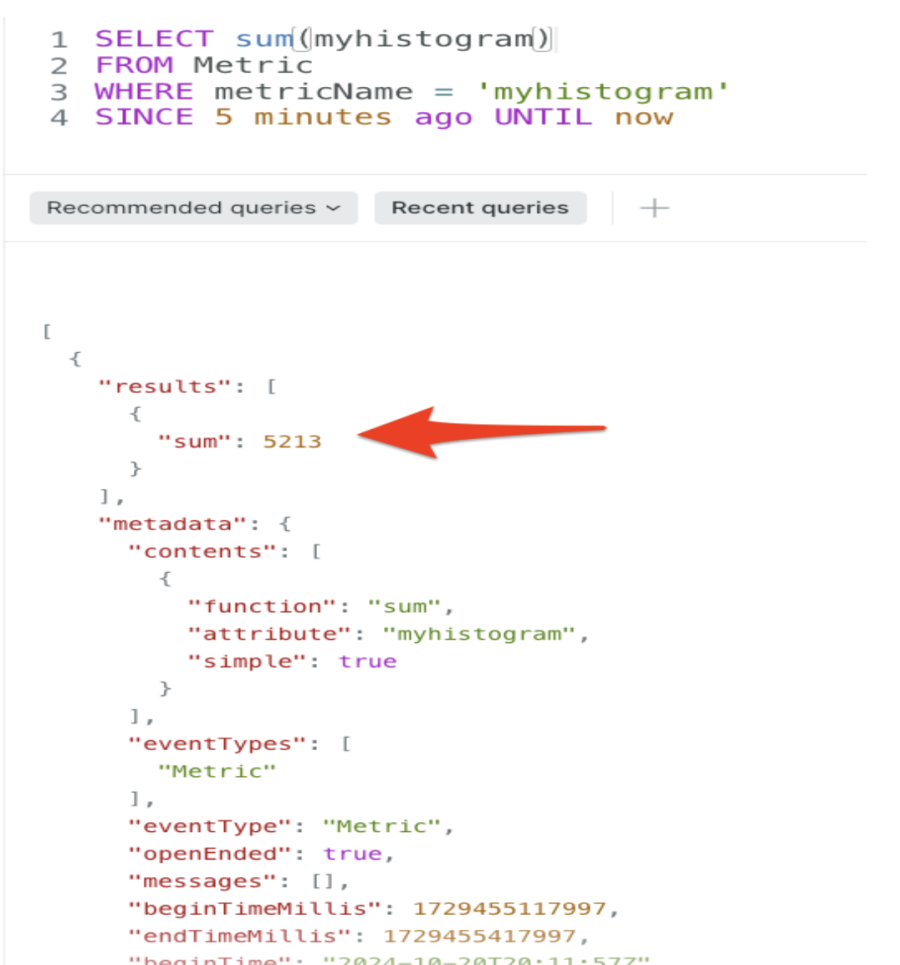
Observable counter
Description: Asynchronous additive non decreasing values.
Mapping:
At Origin (in code) | In Transit (OTLP) | At Rest (New Relic) |
Observable counter | Cumulative monotonic sum | Count |
Here are a couple of examples of observable counter:
- Page faults per process
- CPU time per thread
Step 1: Instrumentation with OpenTelemetry
To create an observable counter in Python:
# Register a call back function
def pf_callback(options: CallbackOptions) -> Iterable[Observation]:
    # Once registered the call back function is automatically invoked
    # for every harvest cycle (every 5 seconds)
    return [Observation(random.randint(1,100), {"pid": 1}),
            Observation(random.randint(1,100), {"pid": 2}),
            Observation(random.randint(1,100), {"pid": 3})]

# Create an Observable counter (asynchronous)
def createObservableCounter(meter):
  meter.create_observable_counter(name="myobservablecounter", description="process page faults", callbacks = [pf_callback])
 time.sleep(20)
Step 2: Storage in NRDB
Table-4 below shows how the Observable Counter origin value is stored in New Relic. The OpenTelemetry harvest cycle in this example is five seconds.
Harvest Cycle | PID | Origin Values | OTLP Value | New Relic Value |
1 | 1 | 56 | 56 | 56 |
1 | 2 | 76 | 76 | 76 |
1 | 3 | 12 | 12 | 12 |
2 | 1 | 74 | 130 | 74 |
2 | 2 | 42 | 118 | 42 |
2 | 3 | 51 | 63 | 51 |
Note: If you just want to store the delta values and cumulative to be stored in NRDB, UNSET this environment variable:
unset OTEL_EXPORTER_OTLP_METRICS_TEMPORALITY_PREFERENCELet’s look at how this data is stored in NRDB:
SELECT myobservablecounter, pid, *
FROM Metric
WHERE metricName = 'myobservablecounter'
SINCE 5 minutes ago UNTIL now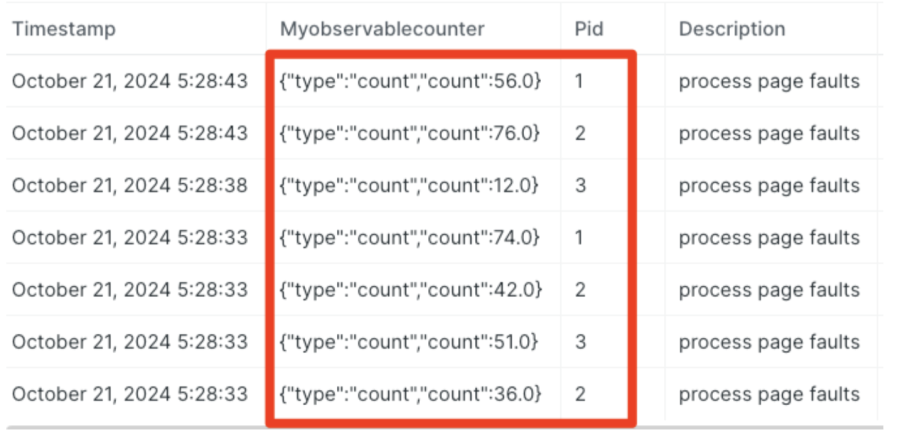
Step 3: Querying with NRQL
To view the sum of myobservablecounter metric values for a given time period, you can run:
SELECT sum(myobservablecounter)
FROM Metric
WHERE metricName = 'myobservablecounter'
SINCE 15 minutes ago UNTIL now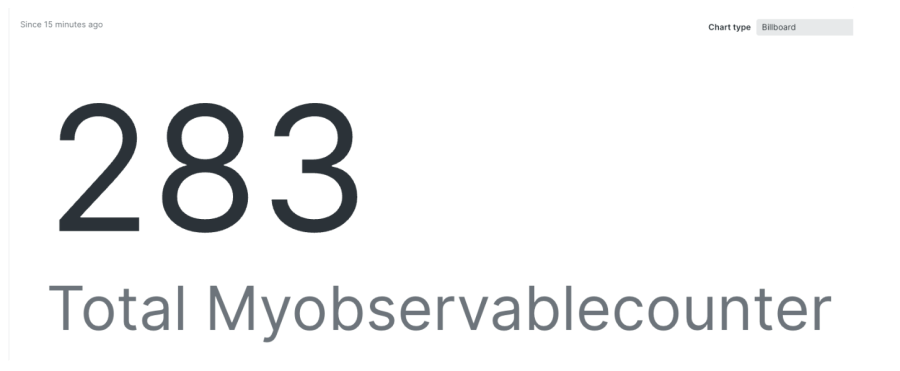
To see the rate of change of myobservablecounter metric values as a TIMESERIES:
SELECT rate(sum(myobservablecounter), 1 minute) FROM Metric WHERE entity.name = 'MyPythonService' AND metricName = 'myobservablecounter' SINCE 15 MINUTES AGO TIMESERIES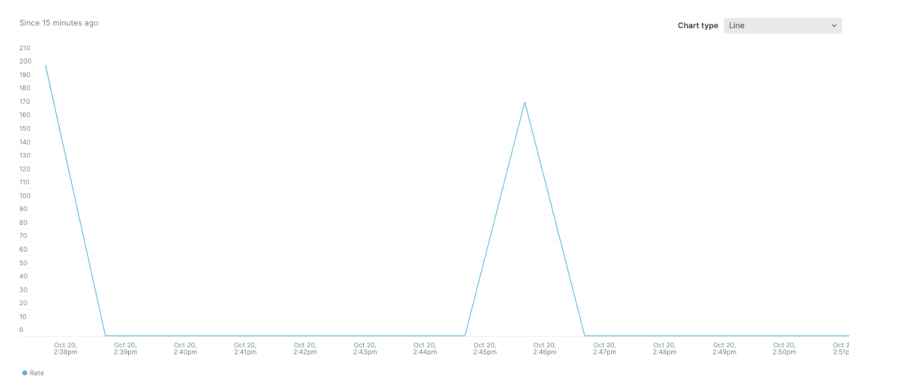
Note that additional metric types like observable histogram and observable gauge can also be sent to New Relic using a similar approach as above. To learn more, check out these resources:
- Understanding the New Relic metric data structure
- Querying the New Relic metric data type
Conclusion
By following this step-by-step guide, you can effectively query OpenTelemetry data in New Relic. By harnessing the power of NRQL, you gain valuable insights, optimize your systems, and elevate your application's observability.
Next steps
Sign up for New Relic today to unlock the full potential of OpenTelemetry and New Relic, and take your application monitoring to a whole new level.
The views expressed on this blog are those of the author and do not necessarily reflect the views of New Relic. Any solutions offered by the author are environment-specific and not part of the commercial solutions or support offered by New Relic. Please join us exclusively at the Explorers Hub (discuss.newrelic.com) for questions and support related to this blog post. This blog may contain links to content on third-party sites. By providing such links, New Relic does not adopt, guarantee, approve or endorse the information, views or products available on such sites.


