With a scaling complex distributed environment, serverless architecture and ever-growing business needs, it gets very difficult to keep a watch on the underlying infrastructure. But your company's success directly depends on the health of its tech stack—including its IT infrastructure, technology systems, digital platforms, and networks.
Monitoring is crucial to maintaining this health, so you need tools that can identify potential issues in real time. Dashboards, visual service maps, and reporting keep systems in check by collecting and analyzing metric data, tracking key performance indicators, and sending alerts about anomalies so you can understand what happened when.
Why observability and what is it?
If monitoring lets you know what happens when, observability helps you understand why it happened and how. It works by examining a system’s outputs to interpret and report on its current state.
Consider the four traditional pillars of observability, which collectively comprise your telemetry signals. You may know these as your MELTsinterpreting
- Metrics: Measurements collected at regular set intervals.
- Events: An unusual change noted in the metrics collected, or a breach in the threshold, results in an event.
- Logs: Time-stamped record of events.
- Traces: Set of events, all part of a logical operation, consolidated across various components of the system. Traces break down to Spans or individual operations within a trace.
Recently, industry knowledge has expanded to include a fifth pillar, profiling or understanding resource usage down to line number while the application runs.
Typically, you might add custom code to your system to generate this information. This process is called instrumentation, and it enables your observability.
Connecting concepts of observability and monitoring
Takeaways
- Monitoring is reactive.Observability is proactive.
- Observability helps understand what monitoring detects.
- Monitoring gets you the known unknowns, while observability brings the unknown unknowns.
A simple analogy
Say an application A (your application) wants to interact with a Database D but is unsuccessful due to heavy traffic. This is what monitoring tells you, the known unknown, i.e., the application can’t reach the database due to some odds).
Another application B (not your application) is also reacting with the database and is performing some heavy transactions with Database D that is causing the traffic. Observability lets us know that there is another application B that is causing the traffic and keeping the database busy. Here, observability is telling you the unknown unknowns by making you aware of the anamoly even when the cause does not lie in your environment.
With observability, in this case, the monitoring tool can be put to use in a way where even before your Application A interacts with the database D. Your observability solution alerts you to the unavailability, making the process proactive rather than reactive.
With monitoring, you understand the unavailability of Database D, but with observability, you are able to detect the root cause being Application B.
What is Open Telemetry?
- An observability framework and toolkit designed to create and manage telemetry data such as traces, metrics, and logs.
- Vendor, tool and language agnostic, so it can be used with a broad variety of different tech stacks and observability backends.
- Focused on the generation, collection, management, and export of telemetry.The storage and visualization of telemetry is intentionally left to other tools.
- Open Telemetry is hosted by the CNCF (Cloud Native Compute Foundation), an open source software foundation that promotes the adoption of cloud native computing.
- Open Telemetry stands second to Kubernetes as the most popular project that CNCF currently incubates.
And what it isn't: OpenTelemetry is not an observability backend like what New Relic offers. For example, you couldn’t use OpenTelemetry alone to monitor or visualize your collected data. You'd need to connect that information to a monitoring platform to actually view and analyze the data.
History
Prior to Open Telemetry there were two projects: Open Census and Open Tracing. Both projects aimed to standardize how to instrument code and send telemetry data to other observability backends. Open Census created a standard for generating and sending metric data, while Open Tracing for traces.
They combined strengths to form Open Telemetry, offering a single unified solution. However, if you are currently using any of the two former projects, you can still seamlessly navigate your way to Open Telemetry.
Did you know? Open Telemetry was accepted into CNCF in 2019 and moved to the incubated maturity level in 2021.
Why Open Telemetry?
Now that we understand why observability is essential, as explained earlier in this document, we need a standard approach for generating the telemetry data that makes it possible. That's exactly what OpenTelemetry provides.
- Helps you own the data you generate by being open-source, it offers the flexibility of no vendor lock-in so you can manage your data the way you like to!
- A standard set of APIs and conventions removes inconsistencies.
Telemetry should be easy, universal, vendor-neutral, loosely coupled and built-in with the code—just like how comments are today. These align with Open Telemetry’s long-term vision and what better an option could we choose?
Open Telemetry can also enhance collaborations between developers, vendors and practitioners by allowing for complete customizations,adding semantic conventions (key: value) pairs thus helping businesses make more sense of their data according to their needs. OpenTelemetry initially launched with production-ready tracing capabilities (its primary focus) for just a few languages like C++, .NET, Java, and JavaScript. Today, the list has expanded dramatically, with implementations at various stages of development (alpha, beta, and production) supporting all the core pillars of observability.
The basic concepts of Open Telemetry
Your MELTS provide a mechanism for your software to describe itself in different ways. But, sometimes, you need to combine instrumentation from two separate codebases to extract meaningful insights, creating a cross-cutting concern which violates core design principles. That's why OpenTelemetry client design requires special attention to prevent software issues down the line.
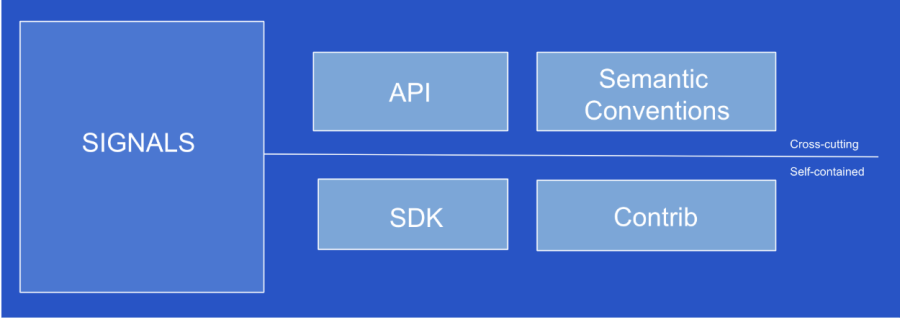
To facilitate this, Open Telemetry has bifurcated the portions of signals that must be imported as cross-cutting concerns from the ones that can be transported independently.
Each signal has four packages:
- API: These consist of cross-cutting public interfaces used for instrumentation. They help in generation of telemetry data, by defining interfaces.
- SDK: These are implementations of the APIs by the Open Telemetry project. It’s to the user’s discretion to use an SDK. These include functionalities like data processing, sampling and even exporting.
- Semantic Conventions: Set of key-value standard pairs that should be used in the attribute fields of all signals. These pairs define the meaning of data, resources and metrics.
- Contrib: Plugins and instrumentation which are maintained by the Open Telemetry project, but are not part of the standard SDK are called contrib packages.

The base architecture of Open Telemetry
Your MELTs are collectively brought together by instrumenting your code with the help of APIs and SDKs,which are then sent over to what we call the collector. The MELTs are sent over to the collector preferably through the exporter. Let us see what each of these mean in detail.
- Exporter: Configures data compliant to the backend to which the telemetry data is being sent and de-couples instrumentation from the backend.
- Collector: The collector, although not mandatory, can be a powerful central component, performing functions like aggregation and sampling on the telemetry data that has been collected.
- It provides flexibility in sending data to any backend and is preferred for secure environments. The collector also contains the receiver, processor and exporter as its components.There are two ways in which the collector can be deployed:
- An agent resides on the same host as the application
- A gateway is a standalone process to which the telemetry data reports. From there, the data is sent to the backend..
- It provides flexibility in sending data to any backend and is preferred for secure environments. The collector also contains the receiver, processor and exporter as its components.There are two ways in which the collector can be deployed:
- Open Telemetry Protocol (OTLP): The native protocol of Open Telemetry that supports transmitting all signals across in a single data stream. This OTLP can be completely translated to the choice of the observability backend you choose.

MoreOpen Telemetry terms
- Baggage: In addition to traces, Open Telemetry provides a mechanism to send across name:value pairs to index and build more context between observability events.
- Context Propagation: All of Open Telemetry’s cross-cutting concerns, signals share an underlying mechanism called context propagation. Context is a mechanism of propagation which carries meaning (e.g., execution associated) across API boundaries between logically aligned units.
- Propagators: Open Telemetry uses propagators as different methods to send across cross-cutting concern values. Different propagators have different restrictions on the means to transfer the telemetry data.
- Instrumentation Libraries: Open Telemetry’s sought-after grail is to make every library out there observable by invoking the Open Telemetry APIs directly.
- Today, there are many libraries that facilitate Open Telemetry observability to certain software and libraries.
You can check to see if these are hosted in the Open Telemetry repository. Use exact naming conventions to search.
Extensibility of Open Telemetry
Open Telemetry's extensible nature is what makes it so valuable. It offers flexibility at every level—including adding custom libraries into SDKs, creating SDK distributions, and building custom exporters and propagators. This versatility makes Open Telemetry the most practical choice for any implementation.
Why New Relic with Open Telemetry?
- Security: When paired with New Relic, you can achieve total 360-degree enterprise security to help detect and mitigate threats.
- Time Complexity: Automations make instrumenting applications with New Relic for observability and monitoring, super seamless. New Relic Intelligent Observability is proactive and can save you substantial time..
- Sustainability: Since Open Telemetry is rapidly growing, it can be difficult to keep up with the pace and maintain stability. New Relic is stable. Upgrades are automatically handled in your production environment.
- Scalability: With growing amounts of telemetry data, it's always better to have a stable platform for ingestion, processing and monitoring. A sturdy tool like New Relic can comprehend voluminous data.
- Digital Experience Monitoring: New Relic helps you correlate data and provides visibility into your users’ Digital Experience. With extensive support for Open Telemetry, New Relic drives sophisticated monitoring.
- Robust: Proactive analysis of the wellness of your infrastructure and business with New Relic’s AIOPS and Intelligent Engine provide you with forecasts of what might impact your business to help you take measures.
Conclusion
Customers choose New Relic with Open Telemetry because it’s a one-stop solution, providing a hyper-scalable telemetry data platform to muster it all and provide deep insights. New Relic doesn't just provide support to Open Telemetry with seamless integration, but is also one among the top contributors to the open source community by providing meaningful insights for Otel’s enhancements and will continue doing so by imparting its experience of 20 years in the realm of observability.
Next steps
Looking to go vendor-agnostic? Delve deeper to learn more on Open Telemetry which will aid you to instrument all edges of your stack. Customers choose New Relic with Open Telemetry because it’s a one-stop solution, providing a hyper-scalable telemetry data platform to muster it all and provide deep insights. Get started today!
The views expressed on this blog are those of the author and do not necessarily reflect the views of New Relic. Any solutions offered by the author are environment-specific and not part of the commercial solutions or support offered by New Relic. Please join us exclusively at the Explorers Hub (discuss.newrelic.com) for questions and support related to this blog post. This blog may contain links to content on third-party sites. By providing such links, New Relic does not adopt, guarantee, approve or endorse the information, views or products available on such sites.


