Slow-running Java applications can lead to a number of challenges such as lost productivity, frustration among your teams, and even lost business. There are a number of reasons why applications can run slowly, but often it boils down to poor performance management. Without the right tools in place, it can be difficult to identify and fix the underlying issues in your application, making it likely you'll have to deal with the same problems over and over again.
In this article, you’ll learn why Java application performance is important, some steps you can take to optimize your Java code, and how you can use an application performance monitoring tool to identify and fix problems quickly and efficiently.
What is Java performance monitoring?
Java performance monitoring refers to observing and analyzing the runtime behavior and efficiency of Java applications to identify and address performance bottlenecks. Monitoring helps developers and system administrators ensure that Java applications run smoothly, efficiently, and meet performance requirements. Key aspects of Java performance monitoring include metrics and measurements, profiling, heap dump analysis, garbage collection analysis, thread analysis, and real-time monitoring.
Why is Java application performance monitoring important?
Java is a versatile and powerful programming language that is widely used in a variety of industries. It is essential to analyze and optimize your Java applications to ensure peak performance. Poorly performing Java applications can have a significant negative impact on various areas of your business, from customer satisfaction to employee productivity. In addition, slow or unreliable applications can increase operating costs and lead to lost revenue. There are a number of factors that can contribute to poor Java performance, including poorly optimized code, inefficient algorithms, and inadequate hardware resources. Let’s take a look at a few ways you can improve your application’s performance.
Types of Java monitoring tools to analyze performance
When choosing a Java monitoring approach, consider the specific needs of your project, whether it's basic JVM monitoring, in-depth profiling, end-to-end application performance monitoring, or a combination of these functionalities. Here are some different types of Java performance monitoring tools:
Basic JVM monitoring tools:
These tools are bundled with the JDK, providing basic monitoring and management features for the Java Virtual Machine (JVM). They offer insights into memory usage, thread information, garbage collection, and basic profiling. Examples: JConsole, Java VisualVM.
Profiling tools:
Tools focused on detailed analysis of application performance. They provide in-depth profiling capabilities, including CPU, memory, and thread profiling, to identify bottlenecks and optimize code.
Examples: YourKit Java Profiler, VisualVM (with profiling plugins).
Application performance monitoring (APM) solutions:
Comprehensive solutions offering end-to-end visibility into application performance. APM tools monitor various aspects, including code-level insights, dependencies, and real-time analytics. They often include features like alerting and distributed tracing.
Metrics and analytics platforms:
Open-source monitoring stacks that focus on collecting and visualizing metrics. These tools allow you to create customizable dashboards and support various integrations for metrics collection and analysis.
Logging and log analysis tools:
Tools dedicated to collecting, indexing, and analyzing log data generated by Java applications. They help in troubleshooting, debugging, and identifying patterns in log entries.
Memory analysis tools:
Tools specialized in analyzing heap dumps and memory-related issues. They assist in identifying memory leaks and inefficient memory usage and provide insights into object retention.
Thread analysis tools:
Tools focused on analyzing thread behavior in Java applications. They help identify issues related to thread contention, deadlocks, and inefficient thread utilization.
Real-time monitoring and alerting tools:
These are tools that provide real-time monitoring and alerting capabilities. They allow you to set up alerts based on predefined thresholds for various metrics, enabling proactive identification of potential performance issues.
See the 2023 State of Java Report today.
What can you do to improve Java application performance?
You can improve Java application performance by focusing on the following two categories: Java code optimization and Java application performance monitoring. These two categories are complementary and work best when combined, but they can be discussed independently. Let's start by looking at some steps you can take to optimize your Java code.
Five ways to optimize your Java code for performance
1. Avoid recursion.
Recursion is a common technique used to reduce a complex problem into a series of simple, repeated problems. In languages that support tail call optimization, recursion can be fast and efficient. Unfortunately, Java is not one of these languages. As a result, recursion is an expensive operation. It may still be appropriate in some circumstances, but in most cases, you should opt for an iterative solution using loops over a recursive solution with Java.
2. Leverage StringBuilder.
Java has a rather dizzying number of options for building longer strings out of smaller pieces. One of the simplest is the += operator.
String thing = "thing";
thing += " 1";
thing += " 2";
thing += " 3";
However, a Java String is immutable—it can't be changed. When you use the += operator, Java copies the first string into a buffer, then adds the second string to the buffer, and finally uses that to create a new string. This repeated copying of memory is very expensive.
Fortunately, Java provides alternatives with StringBuilder and StringBuffer. Both of these classes provide a String-like class that delivers many of the same capabilities, but they are also both mutable data structures. The only real difference between StringBuilder and StringBuffer is that StringBuilder is not synchronized, so it isn't safe to use in multithreaded code unless you provide that synchronization yourself, while StringBuffer is synchronized. Because StringBuilder doesn’t have any overhead from thread synchronization, it’s the fastest way to build large strings from smaller pieces.
StringBuilder thing = new StringBuilder("thing");
thing.append(" 1");
thing.append(" 2");
thing.append(" 3");3. Use stack allocations instead of heap allocations.
Java stores data in two different kinds of memory structures: the stack and the heap. Most programmers are more familiar with heaps. A heap is a dynamically-allocated pool of memory that is visible to all threads. It’s where the Java Virtual Machine (JVM) typically stores objects and classes. Anything inserted into the heap is subject to garbage collection. When the heap has a large amount of data, garbage collection cycles will take longer.
On the other hand, the stack is a fixed-size memory structure that only exists in the thread where it’s running. The JVM stores local variables and method parameters in the stack. It’s also where the JVM stores the stack frame for the current method. The data that goes into the stack is last in, first out (LIFO), so the most recently inserted data is also the first to be removed. It’s similar to a stack of pancakes—the pancakes are added to the top of the stack, and then when someone takes some of the pancakes to eat, they are also taken from the top of the stack, not from the middle or the bottom. When a method returns, the stack frame is removed from the stack and there’s no need for the data to be garbage collected separately. Data simply disappears when the stack frame is removed.
Items stored on the stack, like local variables and primitive types, are quicker to access and use. Java does not provide explicit tools for manipulating what goes onto the stack versus the heap, so it’s important to be aware of how and when Java uses both memory structures and to use primitive types and local variables where possible to implicitly ensure that the JVM uses the stack instead of the heap.
4. Choose the right garbage collector.
This is a topic that can readily fill an entire article on its own. You can choose which garbage collector a given JVM will use, and different garbage collectors each have different design tradeoffs and areas of strength. Which garbage collector you should use depends on your application and environment.
For single-threaded software that can tolerate small, sometimes unpredictable pauses, particularly if it also generates small heaps, the Serial Collector may be the best choice. For multi-threaded software that needs to be responsive to user input, one of the newest garbage collectors, like the Z Collector, is a better choice.
5. Identify and fix slow critical regions.
A critical region is a region of code that is executed often. These areas are particularly sensitive to optimization since the application spends a lot of time in these areas. For that reason, it's important to identify and fix critical regions that have performance issues.
That identification process, however, can be tricky. How do you find critical areas that are good targets for optimization? The answer is to use a tool that gives you observability into your Java application performance. Let’s take a closer look at how you can use New Relic to monitor your Java application.
Java performance monitoring and observability
A good monitoring tool provides actionable real-time insight into how your application is performing. This includes important data that reveals slow critical regions and information on the health of JVMs running your application. The monitoring tool you use should also provide proactive alerting if issues arise. The New Relic Quickstart for Java is such a tool.

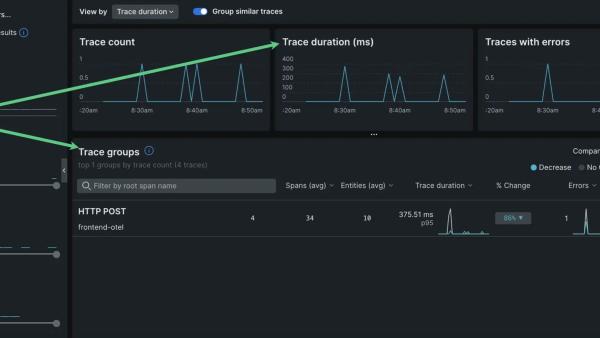
New Relic provides detailed, high-level views of your application's performance, including visualizations of metrics like web transaction time, throughput, error rate, and Apdex score.
New Relic also provides detailed insight into the slowest transactions in your application, so you can optimize the portions of your code that are having the biggest effect on application performance. The next graphic shows how you can drill down and discover which web pages in your application are having performance issues.
You also get real-time JVM monitoring, which includes built-in JVM profiling and thread profiling, as well as detailed insights into your application's logs and errors, which collectively provide deep insight into your application's performance.
Next steps
All of these features combine to deliver invaluable insight into your application's performance, and getting started with New Relic is easy. Sign up for a free account and then add observability to your application with the quickstart for Java in just a few simple steps. You'll enhance how you see your application's performance and get the information you need to make the most of your application.
The views expressed on this blog are those of the author and do not necessarily reflect the views of New Relic. Any solutions offered by the author are environment-specific and not part of the commercial solutions or support offered by New Relic. Please join us exclusively at the Explorers Hub (discuss.newrelic.com) for questions and support related to this blog post. This blog may contain links to content on third-party sites. By providing such links, New Relic does not adopt, guarantee, approve or endorse the information, views or products available on such sites.


