Introduction
No one ever said that alerting was easy. How do we ensure that alerts are delivered in a timely manner while preventing as many false positives and negatives as possible? Additionally, how do we make sure we’re detecting issues on time and not waking up our users in the middle of the night with false alarms? Alert fatigue is a real thing.
As software development moves faster and faster, alerting becomes an indispensable practice, and more so for modern DevOps teams. Why is this the case?
To begin, it’s important to consider the service-level quality of your site performance across different dimensions:
- Reliability. Software is core to the success of your business; you need to know that your systems are up and running correctly.
- Troubleshooting. You can’t fix a problem you don’t know about. If something goes wrong, you need the context to fix it quickly.
- Automation. You can’t manually refresh your homepage every 10 seconds; you need a tool that will watch things for you around the clock, every day of the year.
- Complexity. Your systems are too complicated, and you can’t watch everything all the time; you need an alerting practice that can scale with your system’s growth.
- Outcomes. Ultimately, you’re responsible for the digital experience that you deliver to your customers and stakeholders. Unavailable, broken, or sluggish systems are a sure way for them to lose faith in you.
Because of these essential concerns, we must be vigilant in our actions, and we need guidelines for setting alerts. In this guide, we’ll walk you through how to create and manage an effective alerting strategy for your technology stack. At a high level, we’ll cover
- How shifts in modern technology stacks are leading to shifts in alerting strategies
- Some alerting best practices for dynamic and scaled environments
- How to design and maintain an alerting system useful to your organization and teams
An alerting system, when effectively implemented, is one the most important parts of any successful DevOps team.
Modern Technology Stacks: Affecting Alerting Through Challenges and Change
The demands on your alerting practices have only increased with the shifts in your modern software practices. Orchestrated container environments, microservices architectures, serverless, and cloud-based infrastructures—these are very different approaches to building and managing software than traditional monoliths running in static on-premise data centers. Not surprisingly, monitoring and alerting has had to evolve to address the new challenges presented by these modern systems. Observability, which has come into popularity, points to many of these more sophisticated practices, toolings, and data used to address the challenges of understanding and operating these more complex systems effectively.
Inherent challenges
Organizations can find alerting to be an inherently difficult practice due to structural and competing forces, such as:
- Sensitivity. Overly sensitive systems cause excessive false positive alerts, while less sensitive systems can miss issues and have false negatives. Determining the correct alerting threshold requires ongoing tuning and refinement.
- Fatigue. The common approach to sensitivity is for teams to be more conservative when they set up alerts, but this results in a more sensitive and noisy alerting system. If teams encounter too many false positives, they will begin to ignore alerts and miss real issues, defeating the purpose of an alerting system.
- Maintenance. Systems grow and evolve quickly, but teams are often slow to alerting policies. This leads to an alerting strategy that is simultaneously filled with outdated policy deadwood and gaps where teams aren’t providing coverage to newer changes in their systems.
- Fragmented information. Many teams use multiple different systems to manage alerts across increasingly complex technology stacks, which means that the information needed to diagnose and troubleshoot a problem may be spread across multiple tools.
Changes in technology
Rapid changes in modern technology stacks are demanding different approaches to alerting; for example:
- Resources are ephemeral. Tracking resource metrics can be difficult when resources readily appear and disappear on demand. For example, a container orchestration tool like Kubernetes can destroy a container if the CPU is at 100% and will then bring up a new one. Measuring CPU saturation in a container then becomes much less important than reporting about the pattern of this CPU saturation behavior.
- Systems should scale dynamically. In a modern DevOps world, systems scale up and down quickly. If you have 5 hosts now, you may have 20 hosts an hour later, and just 10 in the following hour. Are your alerting policies dynamically added to the newly created hosts and adjusted for the hosts you’ve removed? Static alert policies are useless in an environment under constant change.
- Services are abstracted. Cloud infrastructure providers like Amazon Web Services (AWS), Microsoft Azure, and Google Cloud Platform (GCP) are increasingly abstracting services and taking on the operational responsibilities that used to be left to Operations teams. Because of this, teams need alerting higher up the stack.
System outcomes vs. root causes
In Google’s Site Reliability Engineering book, the company presents the case for making symptoms vs. causes part of an observability strategy. This reflects a necessary shift in using the observability of outcomes to infer how well the internals of a system are running. When you know something is wrong due to some symptom, only then is it necessary to peel back the cover to see what the cause may be. In mature, static systems with known failure modes, cause-based alerting made sense when teams could identify and understand key bottlenecks. However, with more ephemeral, dynamic, and abstracted systems, new failure modes appear as systems continually change, and the value of identifying specific infrastructure “causes” has become increasingly irrelevant—understanding the final symptoms and outcomes is the practical benchmark to measure against.
Tracking system outcomes in practice
So what does it mean to “track symptoms”? While it’s easy to only focus on the number of 9s in your 99.999% uptime SLA, that doesn’t capture the actual outcomes your systems generate for your customers and your business. Being able to connect “10 minutes of outage” to “1,200 lost orders” and “$24,000 in revenue loss” provides a much more strategic measure of how your systems impact your business. From there, drilling into your underlying services and systems can help connect the true cost of the database crash that led to the outage.
Alerting Design Principles
A lot has been written about alerting policy design, including Rob Ewaschuk’s Philosophy on Alerting, which served as the foundation for Monitoring Distributed Systems: A case study in how Google monitors its complex systems. With that in mind, here are some guidelines to keep in mind when designing your alerts:
- Consider quality over quantity. Confident teams often have sparser, higher quality, and more meaningful alert policies. Teams with less confidence in their alerting strategy often have a “hoarder mentality” and accumulate low quality alert policies that end up being noisy and less useful.
- Create actionable pages. Quality alert policies are actionable and meaningful. Pages should present situations that requires active engagement and response; otherwise, they create needless noise and alert fatigue. Many alert systems function as a constant din of non-actionable notifications—if nothing is wrong, there shouldn’t be any noise from alerts.
- Broadcast informational items. For some alerts, you may need to provide details about system events even if they are not immediately actionable. Broadcast such items to your team, via channels like email or Slack.
- Determine if upstream dependencies are actionable or informational. If there is a failure in an upstream dependency, your team may not be able to do anything about it since they don’t own the dependency. In such cases an informational broadcast is more appropriate. However, if there is something that the team can do to mitigate the impact of the upstream dependency, a page is appropriate.
- Prioritize notifications sent by humans. Humans have an understanding of their systems that automation can’t provide. If a human sends a notification, such as a support person surfacing an issue, prioritize it.
- Invest in alerting automation. As a corollary to prioritizing human notification, automate your policies, notification channels, and incident tracking. The time you spend doing this upfront will save you time later during an actual outage.
- Establish an alerting culture. None of these guidelines are particularly revolutionary, yet engineering teams often fail to establish an alerting culture, leading to gaps in understanding and process. Make sure all your team members understand your alert policies, and document them as part of your overall workflows.
Creating an Alerting Strategy
Base your alerting strategy on system profiles, metrics, and service level objectives (SLOs).
Profiling and prioritization
In your systems, different services behave differently; your alerting policies should be set up differently, too. Here are three considerations for profiling your systems:
- System architecture. A client-server architecture runs very differently from a message-bus architecture. Find the appropriate bottlenecks where alerting should be targeted depending on the architecture of your system.
- Purpose of system. The most important transactions in an e-commerce cart are very different from the most important transactions in an HR management system. Prioritize the most important parts of your system to alert on.
- Expectations of system. A mission-critical customer portal has much higher availability and performance needs compared to an internal testing service. Set alert prioritization where you most expect high functionality.
Triage your alerting setup accordingly: Identify your most important systems; understand the most important outcomes from those systems; set up alerting in those areas; and then work your way down the list to mature your alerting coverage.
Alert metrics for your entire stack
In some organizations, DevOps teams are still typically responsible for metrics related to their technology stack and its uptime, and not necessarily the technology’s corresponding business impact. However, more advanced teams have been able to quantify business impact, which they in turn use to build business cases for investments and prioritization. If your organization is mostly focused on technology-oriented metrics, adding business/customer-oriented alerting and monitoring can serve as a good “smoke test” for whether your systems are actually delivering value to your business and customers.
Here are some example metrics to monitor and alert against. These will vary based on the needs of the business and the services you operate, and you should tune them accordingly.
Customer experience and business metrics
- Mobile app launches
- Traffic throughput
- Successful user story scripts (for example, login or e-commerce purchase)
- Revenue processed
- Impressions and ad clicks
End-user technology metrics
- Page load time
- Mobile crashes
- JavaScript errors
- Ping checks
- Scripted check through a key user processes
APIs and services alerting
- API service
- Transactions
- Service latency
- Uptimes
- Throughput
Infrastructure orchestration
- Pod health
- Instances
- Containers
- Network routing
Infrastructure components
- CPU
- RAM
- Disk I/O
- Storage
Create metrics from SLOs
If you don’t have a ready list of metrics, you could also use service level objectives (SLOs) to create a set of metrics and KPIs that reflect the priorities of your team and organization, and track and alert on those.
For example:
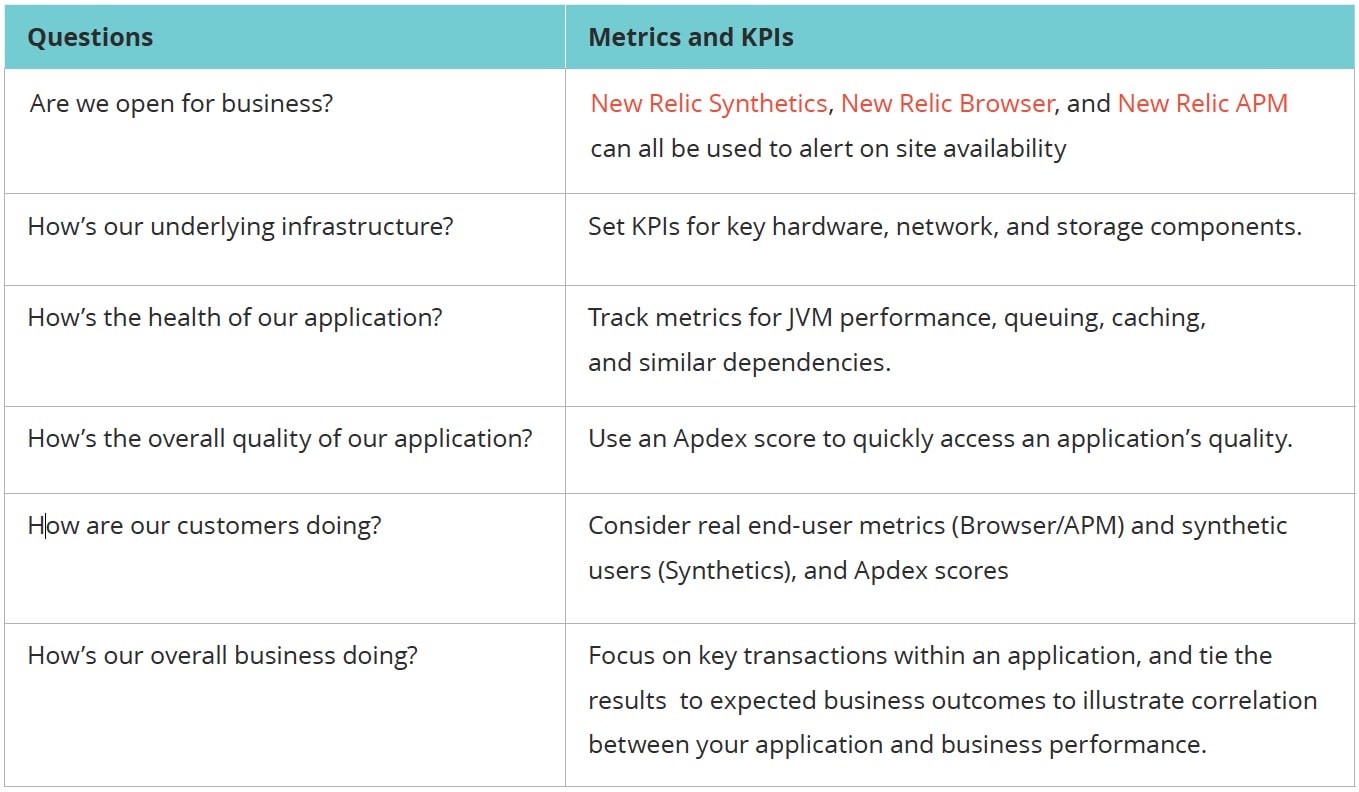
For a more in-depth practitioner tutorial on how to do this in New Relic, check out this tutorial in our Guide to Measuring DevOps Success.
Organizational strategies for alert policies
As your environment grows, the number of alert policies you have can grow quickly, so creating a naming convention for your alerting strategy can make it significantly easier to manage them. While there are many naming approaches you could use, be sure to use one that reflects your team or system priorities.
Consider the following organizational strategies:
Organized by name/team
- Aspen | Critical Alert | PROD
- Aspen | Minor Alert | PROD
- Aspen | Critical Alert | QA
- Aspen | Minor Alert | QA
- Birch | Critical Alert | PROD
- Birch | Minor Alert | PROD
- Birch | Critical Alert | QA
- Birch | Minor Alert | QA
Organized by environment
- Prod | Aspen | Critical
- QA | Aspen | Critical
- Dev | Aspen | Critical
- Prod | Birch | Critical
- QA | Birch | Critical
- Dev | Birch | Critical
Organized by system type
- App | Aspen | Prod
- App | Birch | Prod
- DB2 | Cedar | Prod
- LDAP | Dogwood | Prod
- DB2 | Fir | Prod
Organized by application tier
- App | Aspen | Prod
- App | Birch | Prod
- Data | Mongo | Prod
- Data | DB2 | Prod
- Mgmt | LDAP | Prod
- Mgmt | Registry | Prod
Organized by infrastructure region
- Aspen | us-east-1 | Prod
- Aspen | eu-central-1 | Prod
- Aspen | ap-southeast-2 | Prod
- Birch | us-east-1 | Prod
- Birch | eu-central-1 | Prod
- Birch | ap-southeast-2 | Prod
By mixing and matching the conventions and delimiters, you can create a naming template for your teams to follow:
Template: {team_name}: {environment: Production | Staging | Development} - [{region: US | EU | AP}] - {description: service | service-group | functionality}- {type: OnCall | Shadow | Warning}
Examples:
- Interface: Production [EU] - Metric Indexing - OnCall
- AIS: Production [US] - Pipeline I/O - OnCall
- Pipeline: Staging [EU] - Cassandra I/O - OnCall
- API: Production [AP] - Partner Service - Warning
- Portal: Production [US] - Monitors SLA - OnCall
In addition to these alerting policies used across teams, individuals may want to set up their own alerts if they want to track a particular resource or metric. These policies should include the person’s name to make them easier to identify.
- User | Samantha Martinez | API
- User | Josh Tran | Prod
- User | Michelle Jones | Spark
Alerting for Dynamic and Scaled Environments
Dynamic environments in which systems constantly change may need additional strategies for scalable alert management beyond naming conventions. As your systems scale, it’s important that new apps receive your core set of alerts and that you correctly apply alerting changes across the right set of systems—which can can be difficult if your systems keep changing.
Here are some methods for handling alerts in dynamic environments:
Use labels across environments
By labeling apps and systems, you can dynamically target alerts against these labels and ensure that new systems automatically inherit any default alert policies. For example, adding a “production” label to an app deployed into your production environment ensures that app will automatically receive all the alerts associated with the production label and environment. Additionally, if you modify a policy under the “production” label, those changes are propagated across all the labeled apps, which is significantly more reliable than manually updating the policies for each app.
Manage alerts with APIs
APIs provide a way to automate the creation, modification, and management of alerts. If you use an infrastructure automation tool like Puppet, Chef, Ansible, or Terraform, connect your alerting API endpoints into these systems to ensure that alert policies are programmatically created alongside the resources you provision with these tools.
Define your alerting as code
Another way to automate your alerting system is to define all your alerts as code. In the same way infrastructure-as-code has changed the way teams approach infrastructure provisioning, alerting-as-code brings another level of control around highly scaled alerting systems (and the highly scaled systems they monitor). Alerts-as-code now share many of the same advantages as programming code: You can check it into source control for versioning and backup; it can serve as a documented reference; and you can more easily standardize it across your systems. While some work is needed to programmatically build out your alert policies, the gains from the improved automation are often well worth the time, especially for the most dynamic and complex systems.
Managing Different Alerting Sources
According to a study conducted by Forrester, the typical enterprise has approximately 12 different data types that they monitor across multiple sources, yet many still have challenges with siloed data and gaps in their system visibility. Many factors contribute to this proliferation of data, including siloed and independent business units, differing supported technologies across teams, company acquisitions, and point solutions.
That’s where AIOps technology can help by enabling on-call teams to harness AI and machine learning (ML) capabilities so they can prevent more incidents and respond to them faster. AIOps uses AI and ML to analyze data generated by software systems to predict possible problems, determine the root causes, and drive automation to fix them.
AIOps complements the value you get from monitoring by providing an intelligent feed of incident information alongside your data, and applying AI and ML to analyze and take action on that data more quickly, so you can find, troubleshoot, and respond to incidents faster.
AIOps can help in four main ways:
-
Proactive detection of anomalies before an issue hits production or impacts customer experience or SLOs.
-
Noise reduction to help teams prioritize alerts and focus on the issues that matter most, by correlating related incidents and enriching them with metadata and context.
-
Intelligent alerting and escalation to automatically route incidents to the individuals or teams who are best equipped to respond to them.
-
Automated incident remediation, which includes workflows to resolve the incident when it occurs and reduce mean time to resolution (MTTR)
Making Alerting Work for Your Team
Alerting is ultimately only useful if teams actually leverage the alerts. Many of the challenges companies encounter with alerting are often a reflection of larger issues within their organization. The workflows and processes that comprise your alerting system are vital for not only the effectiveness of your alerting, but also for the effectiveness of your DevOps health and culture.
With that in mind, here are some ways to focus on the human side of alerting:
- Be people first. Your alerting system serves your team, not the other way around. If someone on call finds that an alert needs tuning, they should feel empowered to adjust it accordingly. There are real human costs to repeated 2 a.m. pages. Balance the severity of issues and create guidelines to protect the well-being of your teams as part of your alerting culture.
- Put your customers before your technology. Focus on your customer impact and business outcomes. Use your SLOs to understand how your work impacts your end users. Your customers don’t care how slick your technology stack is; they only care if they can successfully use your service.
- Find and resolve underlying issues. Alerting incidents can really test how well your organization functions. Do you have a single team member who is constantly being paged? Do you have a single point of failure in your team and need cross-training? If there are systemic quality issues, you may have problems in your development or acceptance testing processes. Running exercises like blameless retrospectives and 5 Why's can help drive improvements. As the saying goes, “Never let a crisis go to waste.”
- Groom, review, and tune your alerts. In the same way that you groom ticket backlogs, groom your alerting policies from time to time to ensure their relevance and effectiveness. Make alerting reviews a regular part of sprint reviews and standups to ensure their usage and effectiveness. Be sure to identify which alerts are firing more frequently, the causes for that behavior, and the necessary system remediation or alert tuning required.
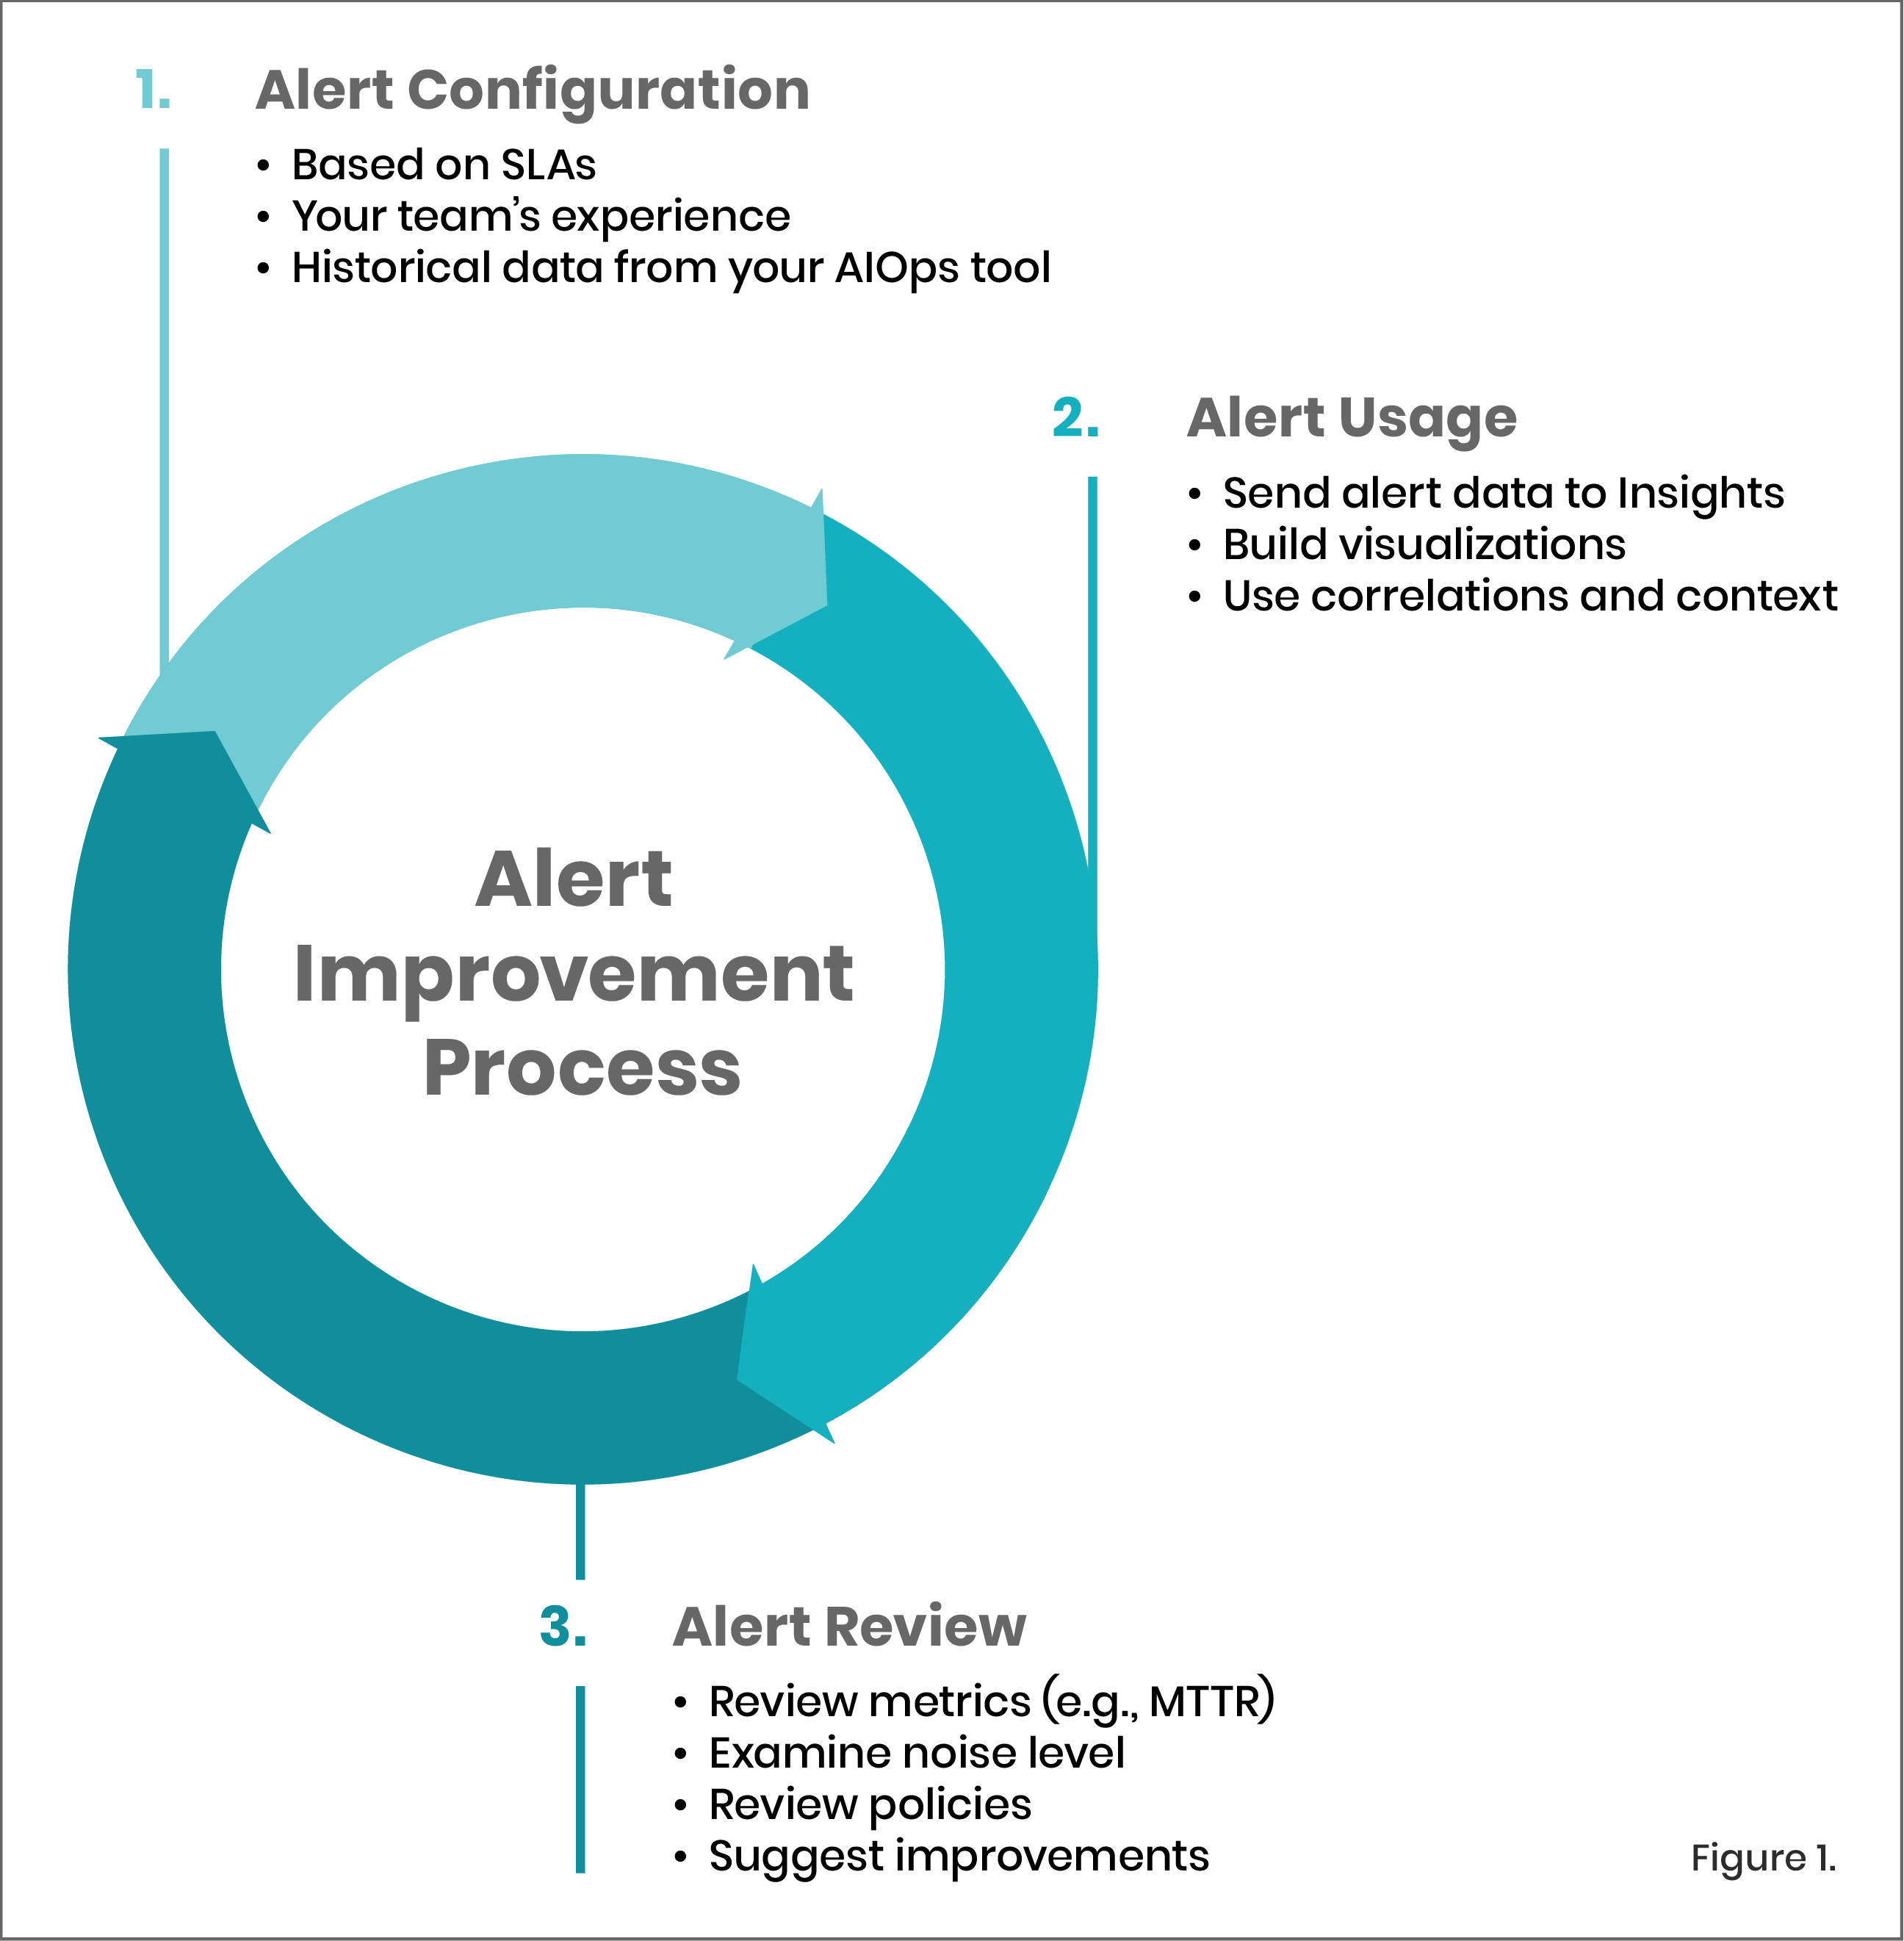
- Removing alerts when you can. Part of the grooming process is pruning alerting deadwood. Incident retrospectives often involve adding more alerts, but this is also a key opportunity to remove duplicate or ineffective alerts. Use an alert improvement process [Fig 1.] to identify which alerts were most actionable during a real incident, so that others can be downgraded to informational warnings or removed completely. AIOps technology can help by automatically correlating related incident events and alerts, suppressing alerts that will auto-resolve or are low priority, providing automatic flapping detection, and providing critical intelligence and context about your incidents to help you diagnose and resolve them faster.
-
Apply muting rules for maintenance windows and planned downtime. In times of planned system disruptions, a steady stream of noisy, unnecessary alerts can be a major distraction. Your alerting system should support muting rules to make it possible to override alert policies and conditions you’ve defined, so you can take more control over your alerts and suppress notifications during times of known system disruptions, such as maintenance windows, deployments, and during testing.
Incident Response Lifecycle Framework
What happens after an alert is raised? What process does your team use to manage incidents? The following framework can help you plan through the lifecycle of an incident:
-
Configure. Set up monitoring, AIOps, and alerting services on your systems, including access, audit, anomaly detection, event correlation, automation, and coverage policies.
-
Detect. An incident is automatically detected as a result of ingested telemetry, and it is modeled, analyzed, and forwarded through the appropriate notification channels, including to collaboration tools like Slack.
-
Combine & Refine. Alerts and telemetry are analyzed, correlated, and enriched with metadata and context to create a single, actionable incident that is used to diagnose and troubleshoot the issue and get closest to root cause.
-
Triage & assign. Understand and prioritize different root causes in context to determine the next steps for resolution, and route incidents to the individuals and teams best equipped to respond to them with the help of AIOps capabilities such as suggested responders.
-
Remediate. Execute the resolution of the issue, including scheduling, routing, development, testing, escalation, and collaboration.
-
Retrospect. Review the incident to expand organizational robustness and prevent future problems with analytics, post mortems, and process changes.
When you establish your incident management process, you must detail how your teams are to prepare, execute, and follow up on incidents, leaving room to improve the process continually. Without a cycle of improvement, teams will perpetually be behind the curve on incidents as your systems increase in complexity and frequency of issues.
Next Steps
Creating an effective alerting system can bring significant leverage to your DevOps culture and help you have greater confidence that your systems are running smoothly and as expected. We encourage you to get alerts up and running on your systems, and to revisit your existing alerts to ensure they’re effectively helping your teams. At a minimum, we encourage you to:
-
Identify a key set of systems that are mission-critical to your business.
-
Set up alerts on these systems, and review existing alerts for effectiveness.
-
Review your incident lifecycle process, such as with a game day or as part of any active incident retrospective.
-
Embed alerting reviews and tuning as part of your ongoing standup or sprint process for iteration and improvement.
If you’re looking for more information about Alerting with New Relic, we’re here to help. New Relic University and our New Relic Alerts documentation have guidance and tutorials on getting more from our alerting services. And our AIOps solution, New Relic AI, empowers your team with intelligence and automation to detect, diagnose, and resolve incidents faster. You can also find additional tips for getting started with alerting on New Relic with this checklist. For even more guidance, our expert services team can help you get your alerting system up and running.
The New Relic platform was designed to find, fix, and optimize problems across your full technology stack. Our modern alerting system was designed to help you sleep better at night knowing that everything is running smoothly.
Successful DevOps starts here
Measure what matters and innovate faster.


