Say goodbye to complexity
Effortless OpenTelemetry for your enterprise
See how OpenTelemetry works
seamlessly with New Relic
QUICK INTEGRATION
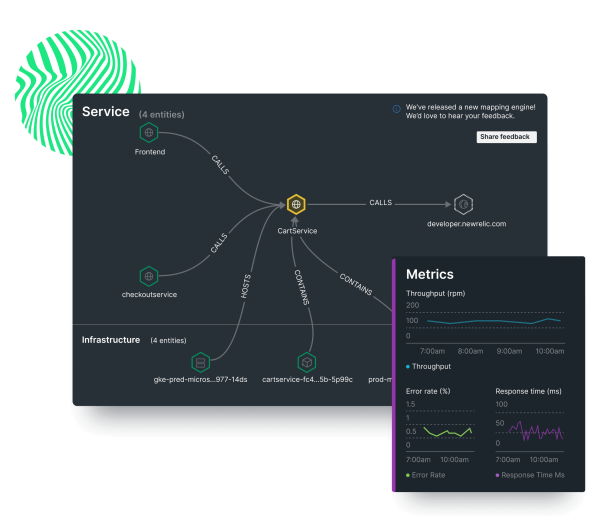
Easily unify your data with native OpenTelemetry support
- Normalize OTel data automatically into the New Relic full APM experience with with APM + OTel Convergence UI (Dashboards, service maps, errors inbox)
- Use the New Relic Distribution of the OpenTelemetry Collector (NRDOT) to simplify setup for hosts, Kubernetes, and hybrid environments
- Choose from OpenTelemetry software development kits (SDKs) or the OpenTelemetry Collector including OTLP traffic over gRPC HTTP/1.1


FLEXIBLE INSTRUMENTATION
OpenTelemetry or New Relic agents. The choice is yours.
- Pick the instrumentation source that fits your workloads—OpenTelemetry, New Relic agents, or both
- No broken dashboards or duplicated alerts when migrating agents with unified telemetry
- Get insight from all your data quickly and easily with one connected experience, no matter the source
FASTER ROOT CAUSE ANALYSIS
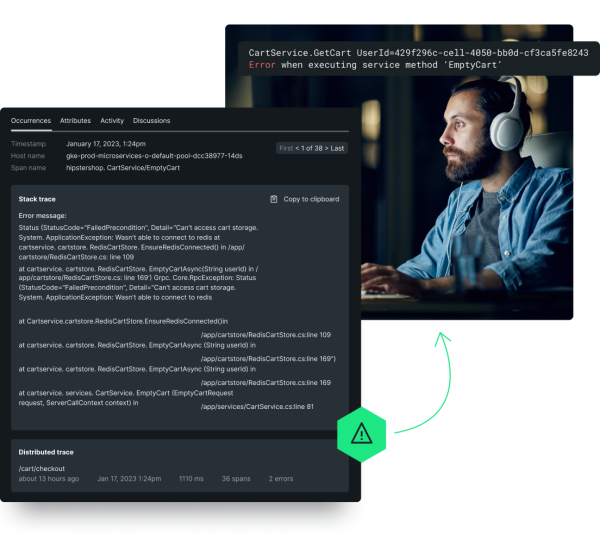
Faster debugging, better performance, complete context
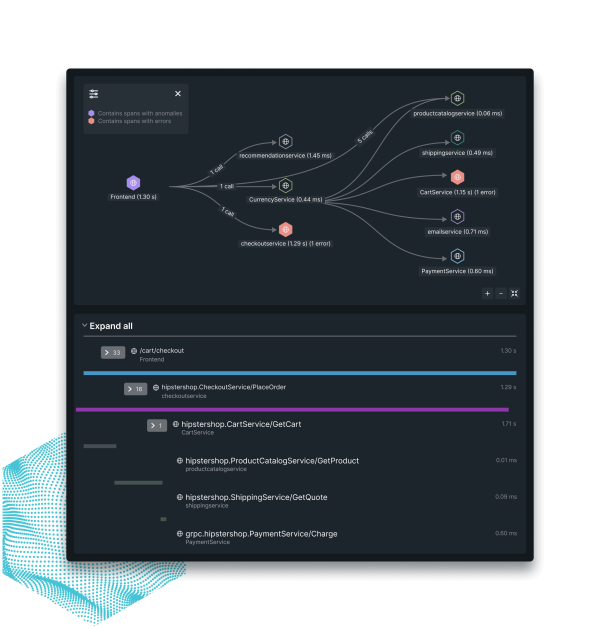
- Correlate data seamlessly to uncover root causes quickly
- Access tailored data views for precise debugging—from logs and distributed tracing, to transactions
- Resolve issues faster and deliver optimal application performance with speed


INVESTING IN OPENTELEMETRY
Your OpenTelemetry adoption partner of choice
- New Relic a CNCF OpenTelemetry contributor with dedicated engineering expertise
- Stay ahead with continuous OTel innovation tailored to your needs
- Join us for an open discussion in our CNCF Slack channel or Explorers Hub

