Find, fix, and prevent—this is the promise of software monitoring. But what happens when costly solutions prevent you from instrumenting everything, and piecemeal approaches create tool sprawl? When application, infrastructure, and end-user performance data is scattered across disconnected monitoring tools, troubleshooting can be needlessly complex and time-consuming.
Enter New Relic One, a massively scalable observability platform that collects and contextualizes all operational data—from any source—and simplifies instrumentation, data ingestion, exploration, correlation, and machine learning-powered analysis to support observability for every organization.
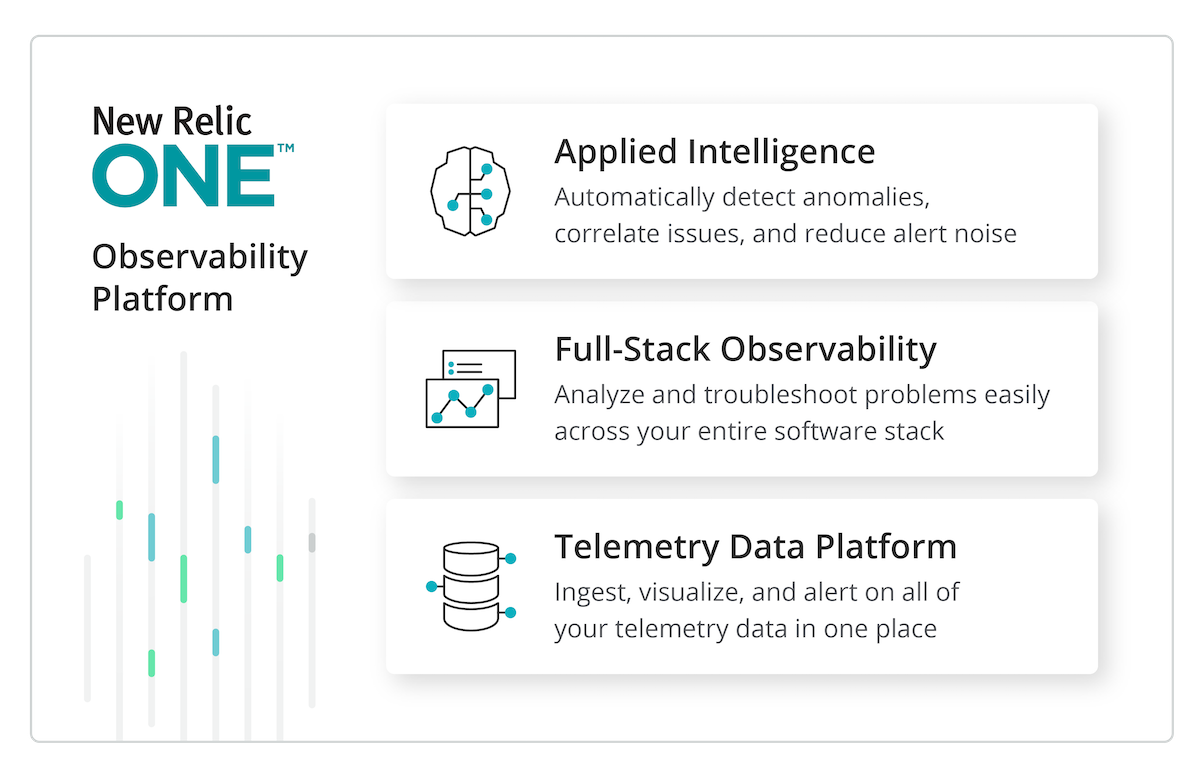
Telemetry Data Platform
All your telemetry data in one place
Collect, explore, and alert on all your metrics, events, logs, and traces from any source in an open and unified telemetry database. Out-of-the-box integrations with open source tools such as Prometheus and Grafana—just to name a few—eliminate the cost and complexity of managing additional data stores.
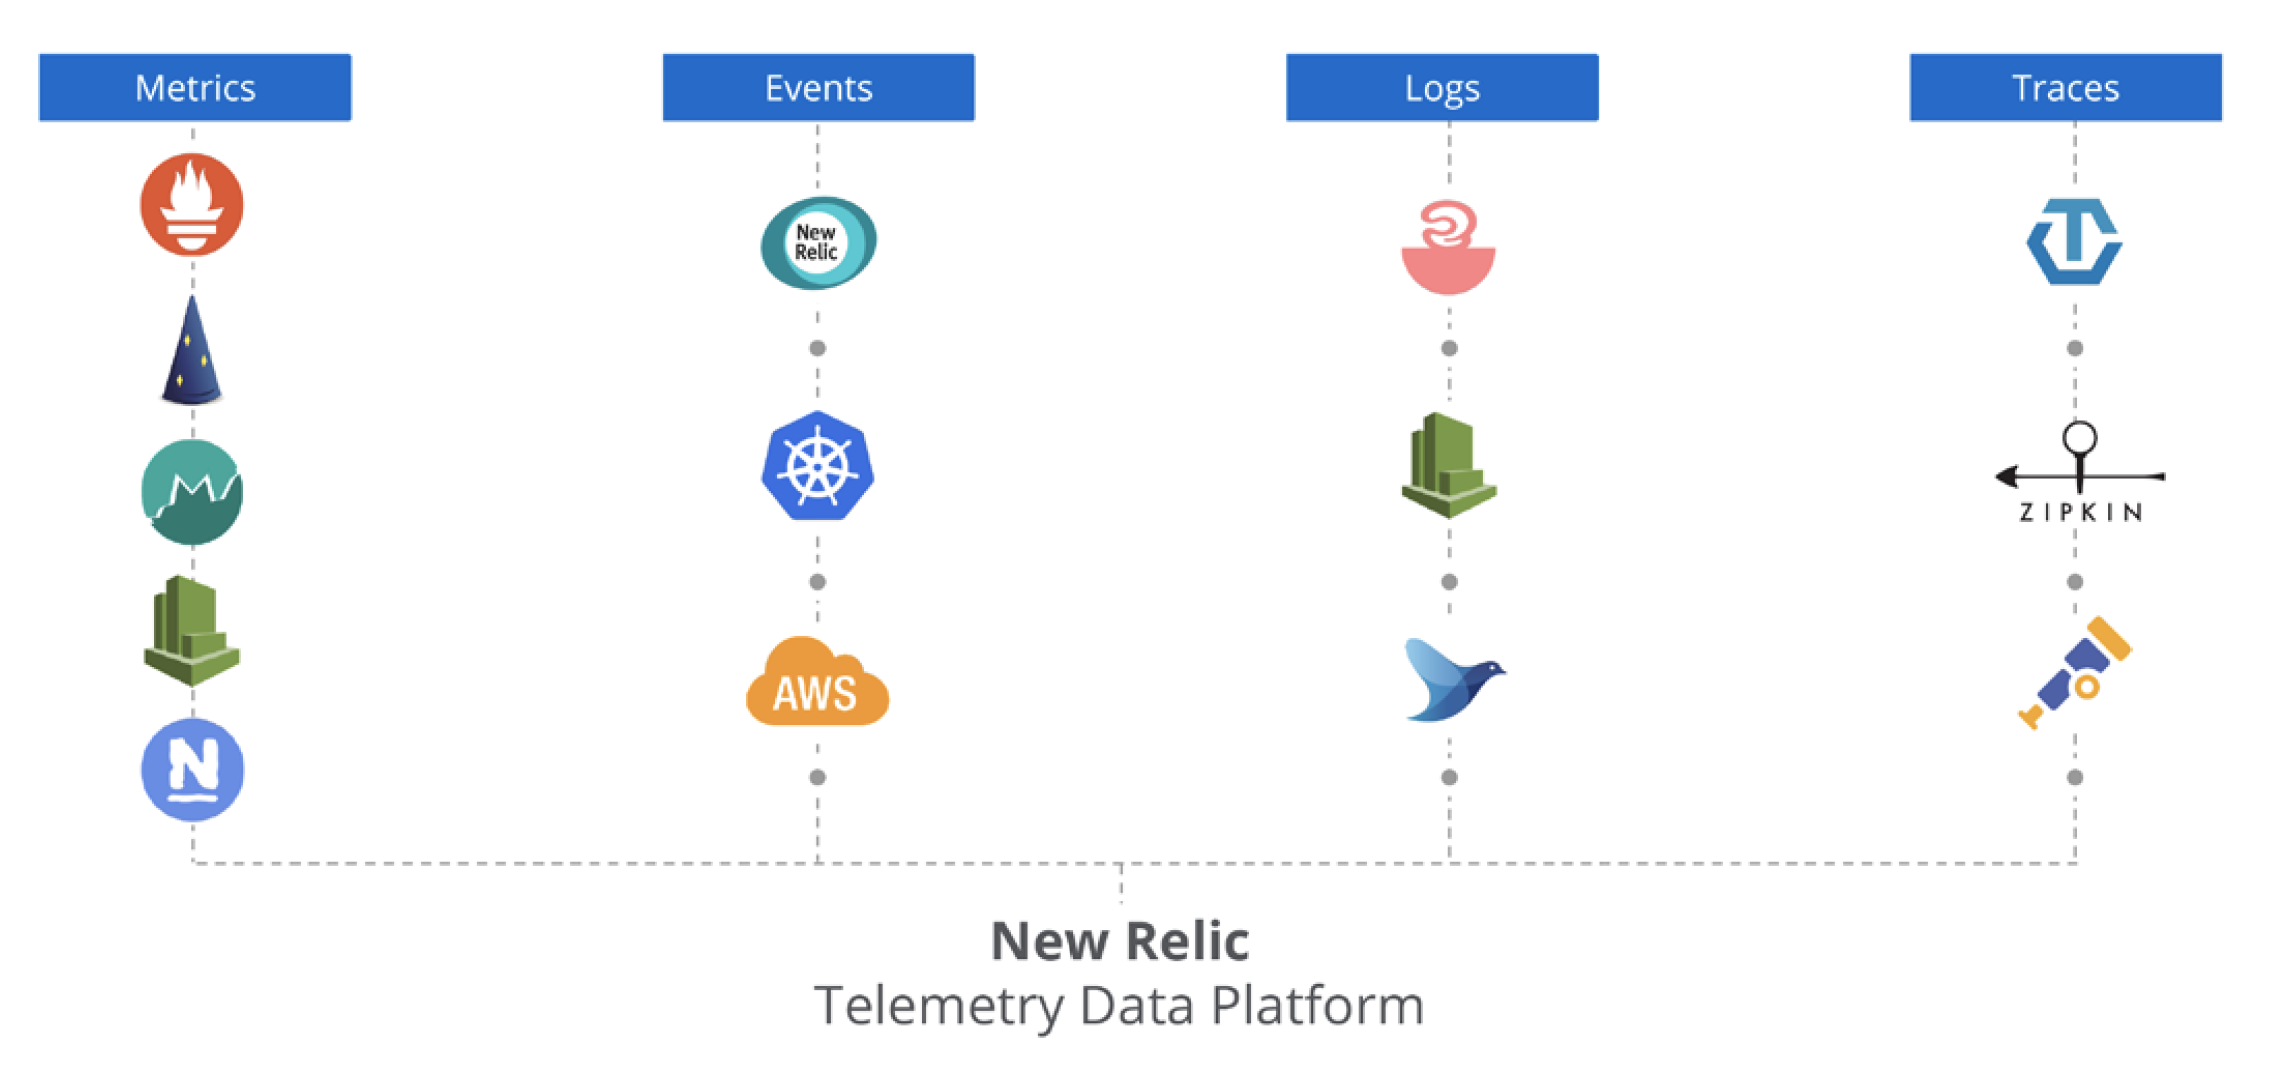
All of your data in one place with Telemetry Data Platform.
With the Telemetry Data Platform, you get:
- Integrations with 300+ agents and standards like OpenTelemetry, so you can ingest and store all of your operational data in one place
- Lightning-fast query and response times
- The choice to build dashboards on New Relic One or keep your existing Grafana workflows
- Real-time alerts on your data
- APIs and tools for creating custom applications hosted on New Relic One
Full-Stack Observability
Visualize and troubleshoot your entire stack in one unified experience
Full-Stack Observability extends the Telemetry Data Platform, and provides one connected experience for understanding system health in context—from logs, infrastructure, applications, and end-user experience data. Eliminate toil and blind spots with curated views that automatically surface issues to your teams before you even know to ask about them.
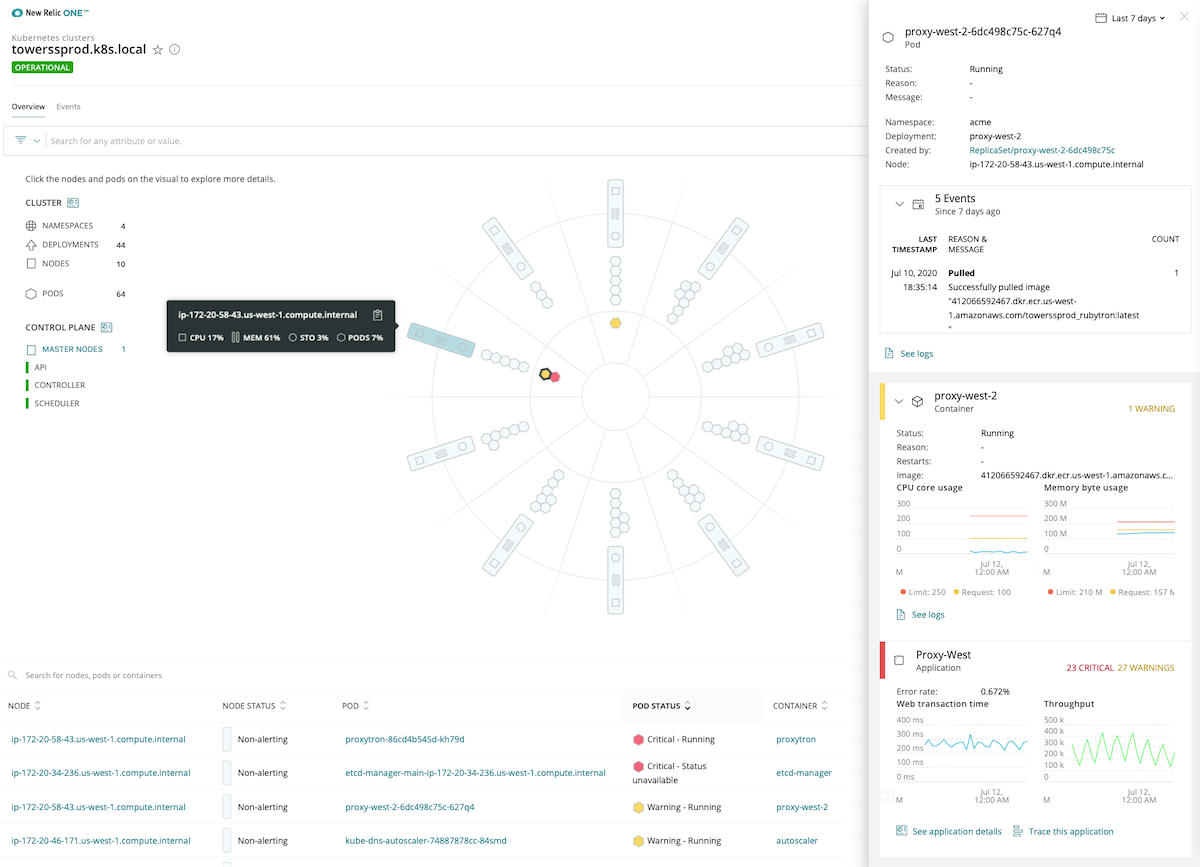
The New Relic Kubernetes cluster explorer showcases all observability elements together: metrics, events, logs, traces.
With Full-Stack Observability, you get:
- All the New Relic functionality you know and love—APM, Infrastructure, Logs in Context, Distributed Tracing, Serverless, Browser, Mobile, and Synthetics—together in one package
- Contextual insight into your distributed services, applications, and serverless functions, no matter how or where you developed them
- Deep visibility into infrastructure hosts, containers, cloud resources, and Kubernetes clusters
- End-to-end performance analysis from backend services through end-user experiences
Applied Intelligence
Detect and resolve issues faster
Detect, understand, and resolve incidents faster with powerful AIOps capabilities. Applied Intelligence automatically detects and explains anomalies before they become incidents, reduces alert fatigue by correlating related alerts, and diagnoses problems by enriching incidents with context, so you can get to the root cause of incidents faster.
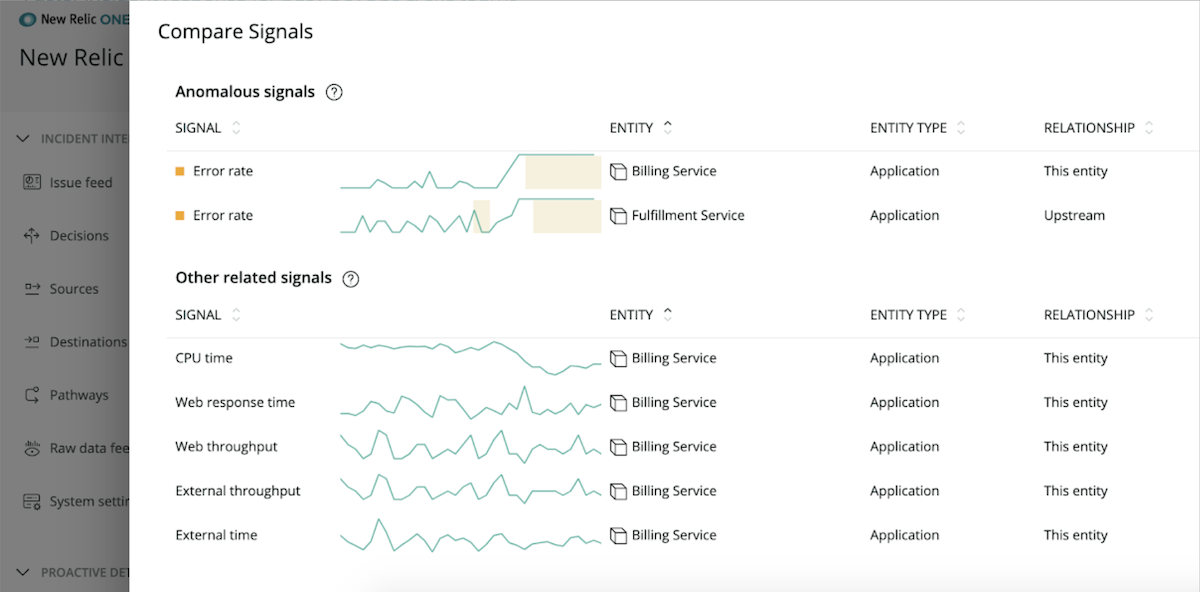
Applied Intelligence leverages machine learning to automate alerts.
With Applied Intelligence, you get:
- Proactive detection that finds anomalies before they become incidents
- Incident intelligence that reduces alert fatigue and prioritizes issues
- Configurations with tools like Slack and PagerDuty for faster diagnosis and response times
Observability Made Simple
With New Relic One you can spend less time troubleshooting and more time building software. Instrument everything to eliminate blind spots—and do it at petabyte scale. Practice full-stack observability, and harness Applied Intelligence and machine learning to detect problems quickly and reduce alert fatigue. Welcome to the age of observability.


