Introduction
Observability has transformed the world of monitoring, and for good reason. Thanks to an abundance of available tools, it’s easier than ever to ship code, but that also means software environments are more complex than they’ve ever been. As our software development practices have evolved, so have our systems. It’s no longer enough to ask if something is wrong in our software stack; we must now also ask why. This is the fundamental function of observability.
To achieve observability, you need to instrument everything and view all your telemetry data in one place—and there are plenty of ongoing debates about the best ways to do this. At New Relic, we believe that metrics, events, logs, and traces (or MELT for short) are the essential data types of observability. When we instrument everything and use MELT to form a fundamental, working knowledge of connections—the relationships and dependencies within our system—as well as its detailed performance and health, we’re practicing observability.
If you’re just getting started with observability, though, the full value of MELT might not be completely clear. There’s a good chance you’ve heard these terms before, but can you confidently describe the differences among them?
Starting with a simple vending machine as an analogy, this guide will walk you through an explanation of metrics, events, logs, and traces, and will demonstrate:
-
How they differ from one another
-
When to use one versus another
-
How they’re used in New Relic One, the first observability platform
Part 1: Events
Conceptually, an event can be defined as a discrete action happening at a moment in time. So, to start with our vending machine analogy, we could define an event to capture the moment when someone makes a purchase from the machine:
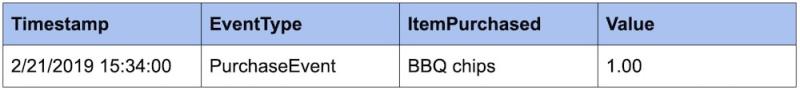
At 3:34pm on 2/21/2019, a bag of BBQ chips was purchased for $1.
Here’s what this event data could look like stored in a database:
We could also define events for actions that do not include a customer, such as when a vendor refills the machine, or for states that are derived from other events, such as an item becoming “sold out” after a purchase.
You can choose which attributes are important to send when defining an event. There’s no hard-and-fast rule about what data an event can contain—you define an event as you see fit. In New Relic, for example, all events have at least a Timestamp and an EventType attribute.
You can also attach multiple measurements as attributes to a single event (although at New Relic, a better way to report metrics would be to use the metric telemetry type, explained in Part 2: Metrics).
How are events used?
Events are valuable, because you can use them to confirm that a particular action occurred at a particular time. For example, we may want to know the last time our machine was refilled. Using events, we can look at the most recent timestamp from the Refilled event type and answer this question immediately.
Because events are basically a history of every individual thing that happened in your system, you can roll them up into aggregates to answer more advanced questions on the fly.
Continuing our PurchaseEvent example from above, imagine that we had the following events stored:
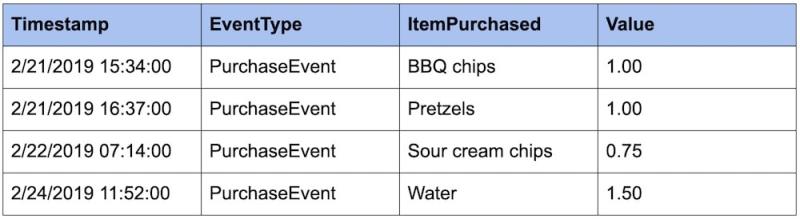
With this data, we could answer practical questions such as, "How much money have I made this week?"
Because we have a history of every purchase event stored, we can simply sum the Value column and see that we’ve made $4.25.
Events become more powerful when you add more metadata to them. For example, we could add additional attributes, such as ItemCategory and PaymentType, so we could run faceted queries against our PurchaseEvent data.
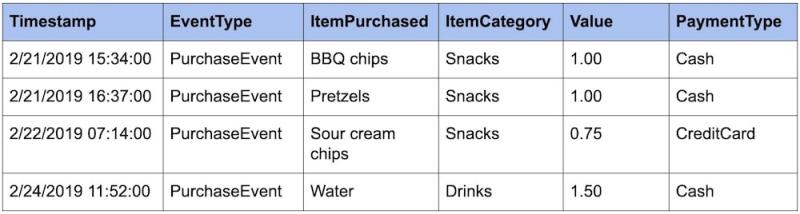
Now we can ask questions such as:
-
How much money did I make off of each item category? (Snacks: $2.75, Drinks: $1.50)
-
How often do people use different payment types? (Cash: 3, CreditCard: 1).
-
How much money did I make per day? (2/21: $2.00, 2/22: $0.75, 2/23: $0, 2/24: $1.50)
Example: Using events in New Relic
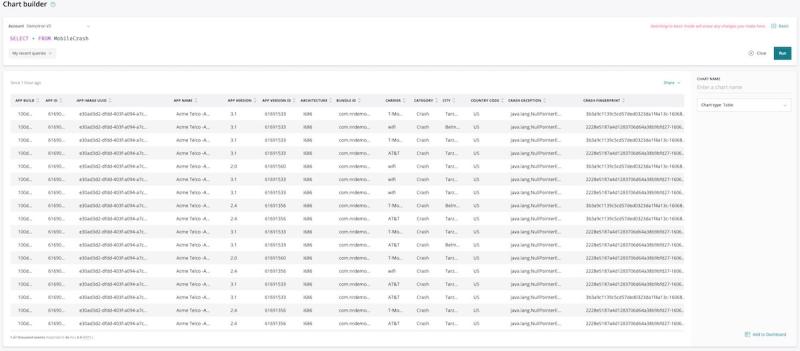
In this example, let’s say we’re a telco company and have multiple customers reporting crashes in our mobile application, “ACME Telco - Android”, and it’s time to do some analysis.
Since we’ve deployed the New Relic Mobile agent, which captures crash data for any app it’s monitoring, we can access the raw underlying MobileCrash event data in New Relic.
In the New Relic One chart builder, we’ll run the following query:
SELECT * FROM MobileCrash
Each row in the following table corresponds to a specific crash event that occurred for a particular user at some point.
Now, let’s say we wanted to ask more useful questions about this data. For example, we might want to know if our app was crashing more often on a particular manufacturer’s devices during the past day.
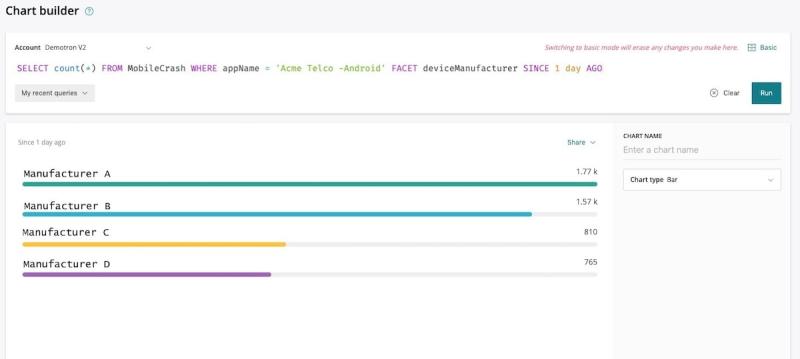
Here, we’d run the following query in chart builder:
SELECT count(*) FROM MobileCrash WHERE appName = 'Acme Telco -Android' FACET deviceManufacturer SINCE 1 day AGO
From the results, we can see pretty clearly that the particular application has failed almost three times more often for Manufacturer A’s line of devices in the past day.
Limitations on events
You may be thinking events sound awesome (“Let’s collect one of everything that happens all the time!”). Well, event collection comes with a cost. Every event takes some amount of computational energy to collect and process. They also take up space in your database—potentially lots of space. So for relatively infrequent things, like a purchase in a vending machine, events are great, but we wouldn’t want to collect an event for everything the vending machine does. For example, let's say that you want to keep a history of the temperature in the vending machine. You could store an event for every minuscule, sub-degree shift in temperature, which would quickly fill up even the largest databases. Or you could instead take a sample of the temperature at a regular interval. This kind of data is better stored as a metric.
Part 2: Metrics
To put it simply, metrics are numeric measurements. Metrics can include:
-
A numeric status at a moment in time (like CPU % used)
-
Aggregated measurements (like a count of events over a one-minute time, or a rate of events-per-minute)
The types of metric aggregation are diverse (for example, average, total, minimum, maximum, sum-of-squares), but all metrics generally share the following traits:
-
A name
-
A timestamp
-
One or more numeric values
A specific example of a metric might look like this:
For the minute of 3:34-3:35pm on 2/21/2019, there were three purchases totaling $2.75.
This metric would be represented in a database as a single row of data:
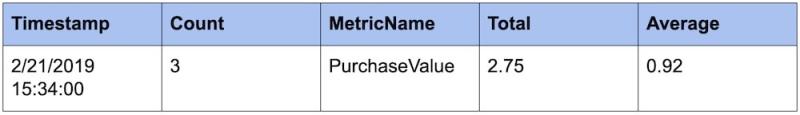
You’ll often see multiple values calculated in a single row to represent different metrics that share the same name, timestamp, and count; in this case, we’re tracking both the Total purchase value as well as the Average purchase value.
Notice that we’ve lost some detail here compared to reporting event data. We no longer know what the specific three purchases were, nor do we have access to their individual values (and this data cannot be recovered). However, this approach requires significantly less storage but still allows us to ask certain critical questions like, “What were my sales over a specific range of time?”
At a practical level, this is the primary difference between metrics and events.
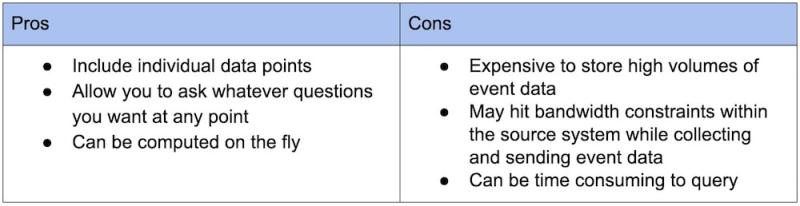
Metrics vs. events
So, what are the pros and cons of metrics and events?
Events
Metrics
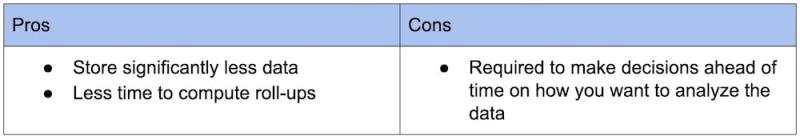
Metrics work well for large bodies of data or data collected at regular intervals when you know what you want to ask ahead of time, but they are less granular than event data. Events are useful when the data is relatively small or sporadic in nature, or when you don’t know the specific aggregates you want to see ahead of time. And each individual event is stored until it’s deleted. (Note that New Relic does allow you to turn event data into metric data.)
Example: Using metrics in New Relic
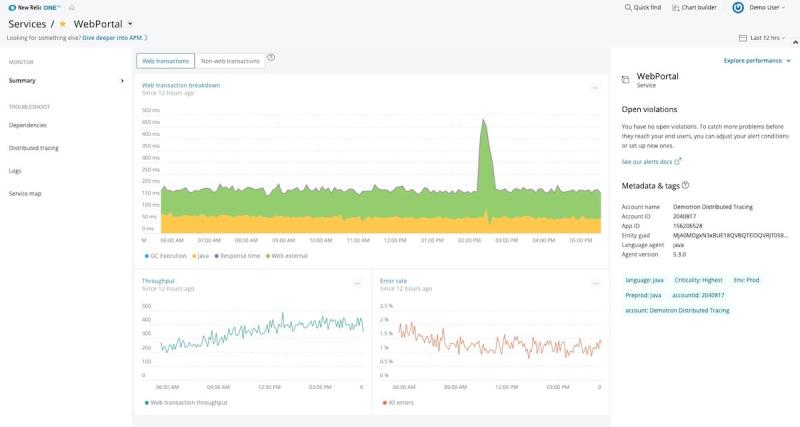
Alongside metrics gathered by New Relic agents, customers can also send metrics from open source tools—such as Prometheus, Micrometer, and DropWizard—and the metrics data they tend to find helpful includes error rate, response time, and throughput.
In the screenshot below, we see a 12-hour window for an application called “WebPortal.” Notice how all the lines are very jagged? This implies a higher level of fidelity in the data.
Now let’s look at another 12-hour window for the same metrics, captured two weeks ago:
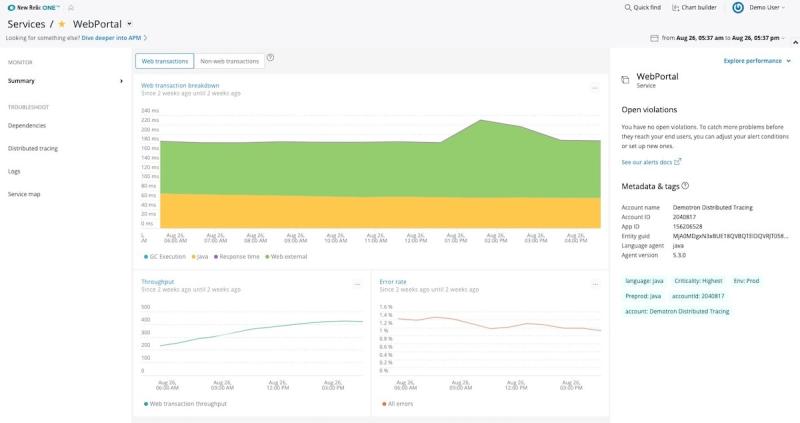
Notice how the lines have smoothed out? This is because the metrics have been further aggregated over time. When the data is fresh, this data represents one-minute spans of time; however, after a certain amount of time has passed, we typically don’t need such high granularity. So, the minute averages get rolled up into hour averages: one data point per hour rather than 60, which saves on storage but sacrifices some detail.
Limitations on metrics
You get a lot of information from metrics in a really compact, cost-effective format. So, why wouldn’t we use metrics all the time? Well, simply put, metrics require careful decision-making. For example, if you knew ahead of time you wanted to know the 50th percentile (median) and the 95th percentile of the metric you’re capturing, you could instrument that, collect it on all of your aggregates, and then graph it. But let’s say you wanted to know the 95th percentile for just the data of a particular item in the vending machine. You can’t calculate that after the fact; you would need all the raw sample events to do that. So, for metrics, you must decide ahead of time about how you want to analyze the data and set it up to support that analysis.
Part 3: Logs
It’s not a stretch to say that logs are the original data type. In their most fundamental form, logs are essentially just lines of text a system produces when certain code blocks get executed. Developers rely on them heavily in order to troubleshoot their code and to retroactively verify and interrogate the code’s execution. In fact, logs are incredibly valuable for troubleshooting databases, caches, load balancers, or older proprietary systems that aren’t friendly to in-process instrumentation, to name a few.
Similar to events, log data is discrete—it’s not aggregated—and can occur at irregular time intervals. Logs are also usually much more granular than events. In fact, one event can correlate to many log lines.
Let’s consider our original vending machine event:
At 3:34pm on 2/21/2019, a bag of BBQ chips was purchased for $1.
The corresponding log data might look like this:
2/21/2019 15:33:14: User pressed the button ‘B’
2/21/2019 15:33:17: User pressed the button ‘4’
2/21/2019 15:33:17: ‘Tasty BBQ Chips’ were selected
2/21/2019 15:33:17: Prompted user to pay $1.00
2/21/2019 15:33:21: User inserted $0.25 remaining balance is $0.75
2/21/2019 15:33:33: User inserted $0.25 remaining balance is $0.50
2/21/2019 15:33:46: User inserted $0.25 remaining balance is $0.25
2/21/2019 15:34:01: User inserted $0.25 remaining balance is $0.00
2/21/2019 15:34:03: Dispensing item ‘Tasty BBQ Chips’
2/21/2019 15:34:03: Dispensing change: $0.00
Log data is sometimes unstructured, and therefore hard to parse in a systematic way; however, these days you’re more likely to encounter “structured log data” that is formatted specifically to be parsed by a machine. Structured log data makes it easier and faster to search the data and derive events or metrics from the data.
For instance, if we changed the log line from:
2/21/2019 15:34:03: Dispensing item ‘Tasty BBQ Chips’
To:
2/21/2019 15:34:03: { actionType: purchaseCompleted, machineId: 2099, itemName: ‘Tasty BBQ Chips’, itemValue: 1.00 }
We could now search logs for purchaseCompleted and parse out the name and value of the item on the fly.
When are logs useful?
Logs are incredibly versatile and have many use cases, and most software systems can emit log data. The most common use case for logs is for getting a detailed, play-by-play record of what happened at a particular time.
Let’s say, for instance, that we have a PurchaseFailed event that looks something like this:

From this, we know that a purchase was attempted and failed for some unforeseen reason at a particular time, but we don’t have any additional attributes that give us insight as to why the purchase failed. The logs, however, may tell us something like this:
2/21/2019 15:33:14: User pressed the button ‘B’
2/21/2019 15:33:17: User pressed the button ‘9’
2/21/2019 15:33:17: ERROR: Invalid code ‘B9’ entered by user
2/21/2019 15:33:17: Failure to complete purchase, reverting to ready state
We now know exactly what went wrong: The user entered an invalid code.
Example: Logs in New Relic
New Relic Logs are extremely useful for troubleshooting errors as soon as they occur.
For example, in our “WebPortal” application, we see an error message for an invalid character exception:
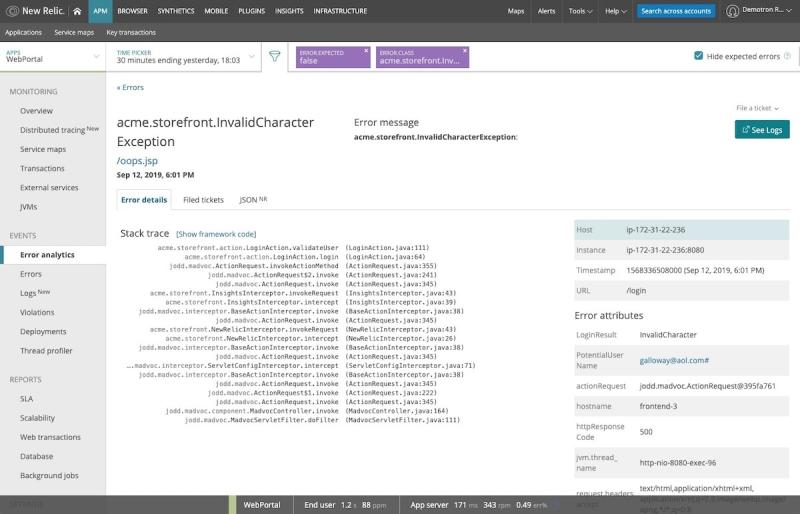
From here, we can click See Logs, and New Relic One presents us logs from that specific error transaction:
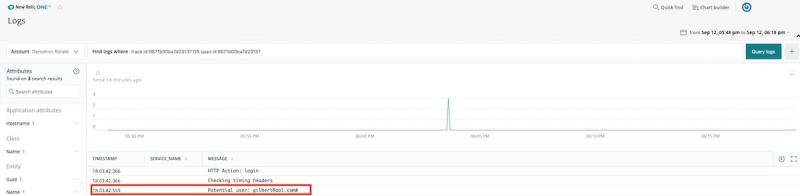
In this case, we see that a user passed an incorrect username—they simply mistyped a character.
Part 4: Traces
Traces—or more precisely, “distributed traces”—are samples of causal chains of events (or transactions) between different components in a microservices ecosystem. And like events and logs, traces are discrete and irregular in occurrence.
Let’s say our vending machine accepts cash and credit cards. If a user makes a purchase with a credit card, the transaction has to flow through the vending machine via a backend connection, contact the credit card company, and then contact the issuing bank.
In monitoring the vending machine, we could easily set up an event that looks something like this:
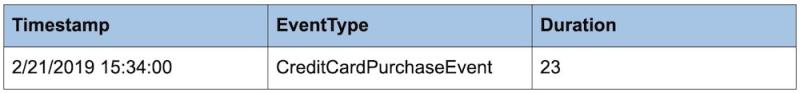
This event tells us that an item was purchased via credit card at a particular time, and it took 23 seconds to complete the transaction. But what if 23 seconds is too long? Was it our backend service, the credit card company’s service, or the issuing bank’s service slowing things down? Questions like this are exactly what traces are meant to address.
How do traces work?
Traces that are stitched together form special events called “spans”; spans help you track a causal chain through a microservices ecosystem for a single transaction. To accomplish this, each service passes correlation identifiers, known as “trace context,” to each other; this trace context is used to add attributes on the span.
So, an example of a distributed trace composed of the spans in our credit card transaction might look like this:
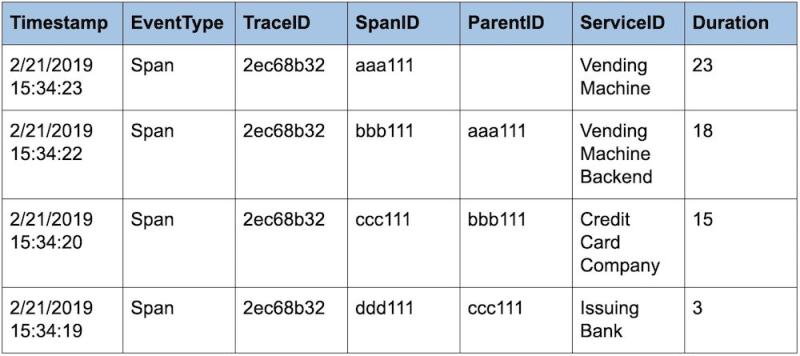
If we look at the Timestamp and Duration data, we can see that the slowest service in the transaction is the credit card company’s; it’s taking 12 of the 23 seconds—that’s more than half the time for this entire trace!
How’d we get 12 seconds? The span to contact the issuing bank is what we call a child span, the span to contact the credit card company is its parent. So if the bank request took 3 seconds, and the credit card company took 15 seconds, and we subtract the child from the parent, we see that it took 12 seconds to process the credit card transaction—over half the total time of the trace.
When should you use traces?
Trace data is needed when you care about the relationships between services/entities. If you only had raw events for each service in isolation, you’d have no way of reconstructing a single chain between services for a particular transaction.
Additionally, applications often call multiple other applications depending on the task they’re trying to accomplish; they also often process data in parallel, so the call-chain can be inconsistent and timing can be unreliable for correlation. The only way to ensure a consistent call-chain is to pass trace context between each service to uniquely identify a single transaction through the entire chain.
Example: Distributed tracing in New Relic
New Relic One captures trace data via its distributed tracing feature.
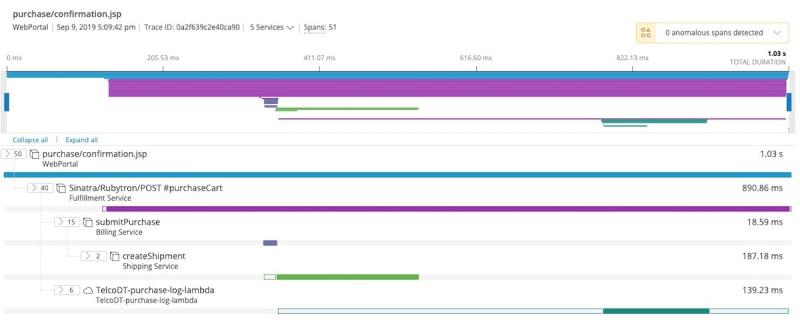
In this particular example, our “WebPortal” application has a page called purchase/confirmation.jsp. This page calls the “Fulfillment Service,” which calls the “Billing Service,” which calls the “Shipping Service.” Each colored rectangle denotes how long a nested service call lasted; the longer the rectangle, the more time spent in that particular service.
Redefine how you ask “Why?”
It doesn’t matter if you’re just getting started with observability or are a seasoned DevOps pro—understanding the use cases for each MELT data type is an essential part of building your observability practice.
Once you understand these data types, you’ll better understand how to work with an observability platform such as New Relic One to connect your telemetry data—be it open source or vendor-specific—to understand relationships and make sense of the data as it relates to your business. When you can visualize dependencies and view detailed telemetry data in real time, you can more quickly and easily resolve system problems and prevent those issues from occurring again in your applications and infrastructure. This is how you ensure reliability.
With New Relic One—the industry’s first observability platform that is open, connected, and programmable—we’re redefining how you ask why and what’s possible in observability. And it all starts with MELT.
To learn more about these data types and how they’re used in New Relic, check out our data types documentation.
More perfect software
Try New Relic One today and start building better, more resilient software experiences. Visit newrelic.com/platform.