Monitor your entire .NET environment
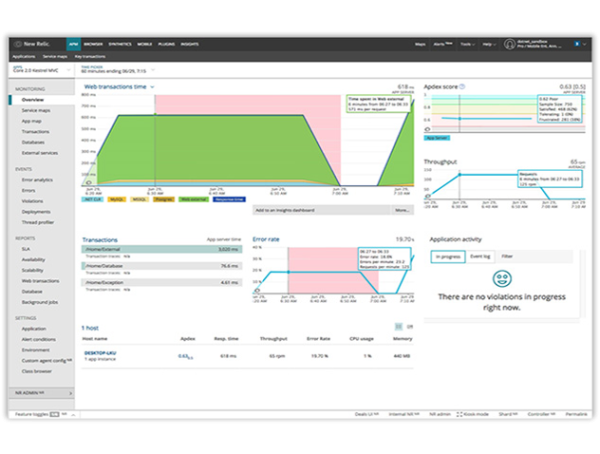
Resolve problems affecting the customer experience faster by easily identifying bottlenecks in your .NET applications and services.
- Build business-wide dashboards to keep apps running fast and healthy
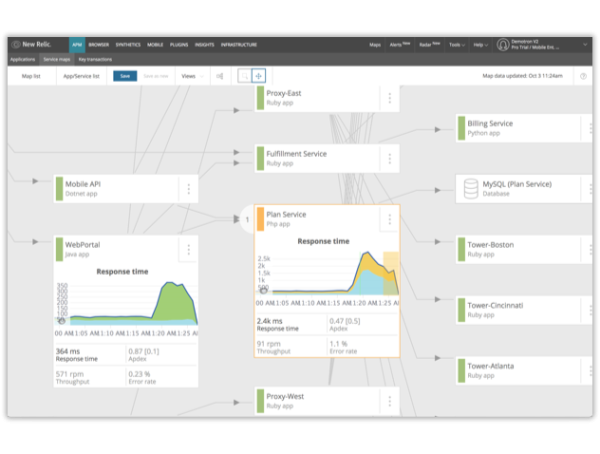
- Understand distributed app and service dependencies using Service Maps
- Diagnose and solve issues in production with performance profiling
- Monitor apps running in private data centers, virtual private cloud, and public cloud as well as on-prem hosts, AWS EC2, Azure VMs, and Azure Cloud Services
- Compare the performance of your .NET apps before and after code deployments
Say goodbye to “cowboy” deployments
With observability across both existing .NET applications and new .NET Core services, you’ll have the peace of mind that the answers are here when you need them.
- Monitor .NET Framework and .NET Core side-by-side along with other languages and non-Microsoft components
- Auto-instrumentation gets teams up and running quickly with out-of-the-box observability, even across asynchronous services
- Real user monitoring lets you track page load times next to browser data
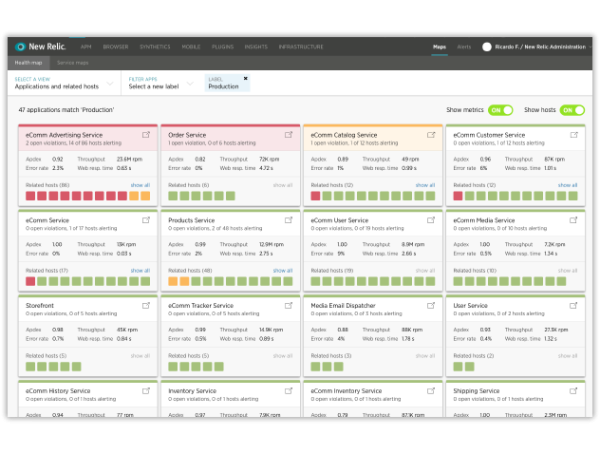
- Visualize .NET apps and the infrastructure they’re running on together in Health Map
- Get alerts for application errors and exceptions to fix problems before they affect users


Align your teams and your time
Easily spot the .NET apps and services that are negatively impacting your customer experience—and know how and where you should spend remediation efforts.
- Send detailed notifications to team members when errors arise before apps and services go down
- Pinpoint slow requests and create issue-tracking tickets that bundle stack traces with error details
- Easily identify and hand off problems between IT operations and engineering team members
- Discover ways to do more with less based on the insights you gain from real data
.NET monitoring across diverse environments
Frameworks
MVC 5
Web API v2
WCF
Web Forms
.NET
ASP.NET and ASP.NET Core
.NET Framework & Core
IIS & Kestrel
OWIN
Cloud
Azure
AWS
GCP
Pivotal
has us open.
See transactions across external services and datastores
Integrated Instrumentation
MSMQ
RabbitMQ
RestSharp
External calls
SQL Datastores
SQL Server
MySQL
IBM DB2
Oracle
NoSQL Datastores
Couchbase
MongoDB
Redis
PostGreSQL
Install the New Relic agent
Check out our documentation for step-by-step guidance.
Compile and deploy your application
Check out additional instrumentation and start digging into your .NET performance data.