Visualize, navigate, and improve your entire stack
- Get complete app visibility for everything from backend APIs to frontend user devices
- View traces and logs in context for better data correlation across your full stack
- Visualize dependencies with automap and external services
- Rally around golden metrics and Apdex scores to identify bottlenecks and optimize performance
Never miss a trace again
- Observe 100% of your distributed traces (up to 2M spans per minute) with New Relic Edge with Infinite Tracing
- Head-based sampling gives key representative insights
- Drill into errors and slow traces to find the root cause faster
- Group traces to better understand errors and anomalies
- Optimize for data cost-visibility with span attribute trace filters and set rules with trace observer monitor
Code-level visibility for faster troubleshooting
- Create alerts for your preferred metrics and channels
- Analyze errors and time consuming requests to uncover trouble areas
- Diagnose cluster behavior and troubleshoot performance bottlenecks with real-time Java profiler
- Determine root cause faster with logs in context and transaction traces
- Unified pattern recognition and machine learning help you sift through data faster
Proactive workflows to improve system health
- Detect, triage, and troubleshoot errors with Errors Inbox
- Use deployment markers to understand how code releases impact performance
- Dependency and service maps highlight components causing performance issues
- Manage SLOs like a pro with automated service level management
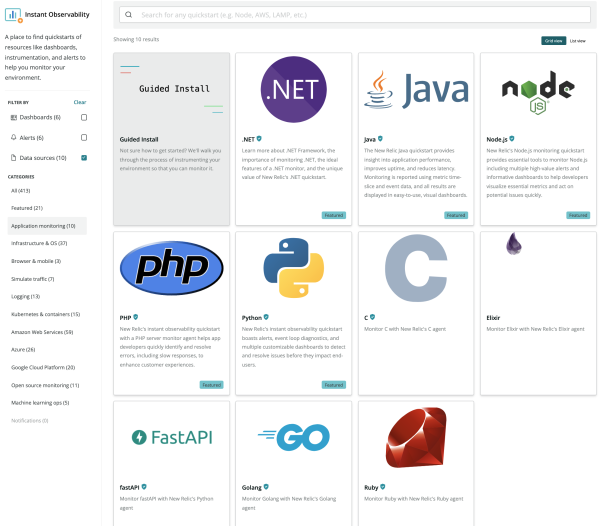
Monitor your current and future stack
- Get started fast with integrations for the most popular languages, frameworks, and cloud providers, including open standards like OpenTelemetry
- Tailored guided installs make setup fast and easy
- Browse New Relic I/O for preconfigured dashboards and alerts for your environment