WHY USE THE POSTMAN QUICKSTART?
Collaborate and create better APIs faster.
API observability, now made easy.
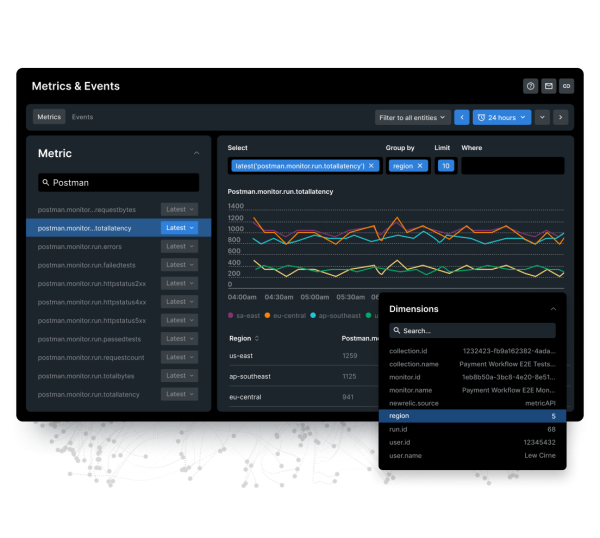
- Instantly view all of your critical metrics in one place.
- See metrics such as latency, request counts, and error rates in context of all your telemetry data.
- Start monitoring API performance fast, and for free, with a pre-built dashboard.

Get end-to-end visibility right out of the box.
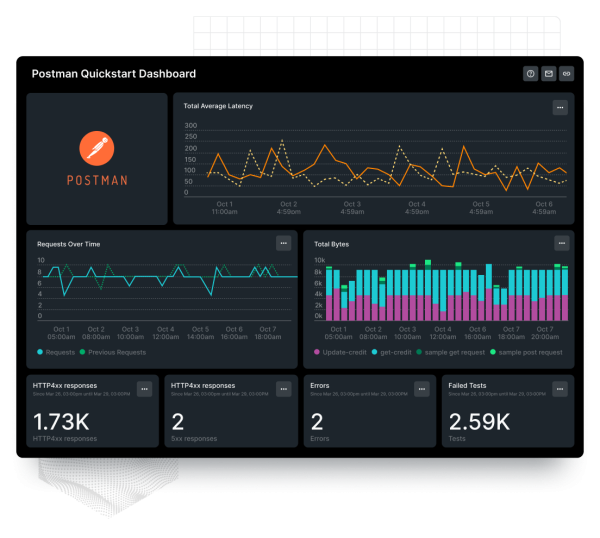
- See all of your key metric data in a curated, pre-built dashboard.
- Get a view of average latency, total request count, and byte traffic over time.
- Get a real-time tally of recent errors and failed tests, and measure API 4xx and 5xx errors.
Work faster, maintain quality easier.
- Get complete data visibility with critical API observability during rapid iteration cycles.
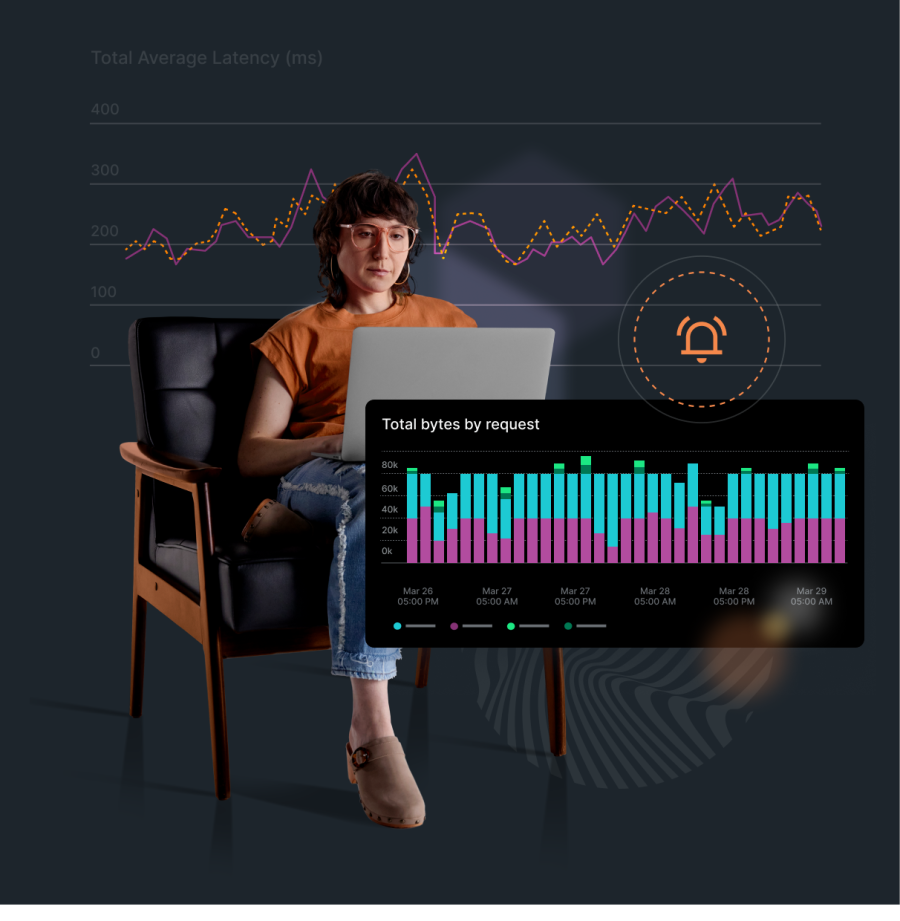
- Instantly check real-time performance to quickly fix errors before they become problems.
- Easily ensure quality from design, testing, and documentation to mocking and discovery.


