
Complete solution to PHP monitoring
Use a PHP server monitor agent and let developers see a high-level summary of their app performance in a comprehensive PHP dashboard. Help teams monitor the app's Apdex, build architectural maps, and find and resolve errors quickly.
A PHP server monitor collects and analyzes application data that drive data-driven decisions. Organize data, query data using NRQL, and visualize data (in customizable interactive dashboards) that directly impact customer experiences.

What’s included?
Our PHP quickstart include out-of-the-box dashboards and alerts, including
- Alerts including error rates, duration, and throughput
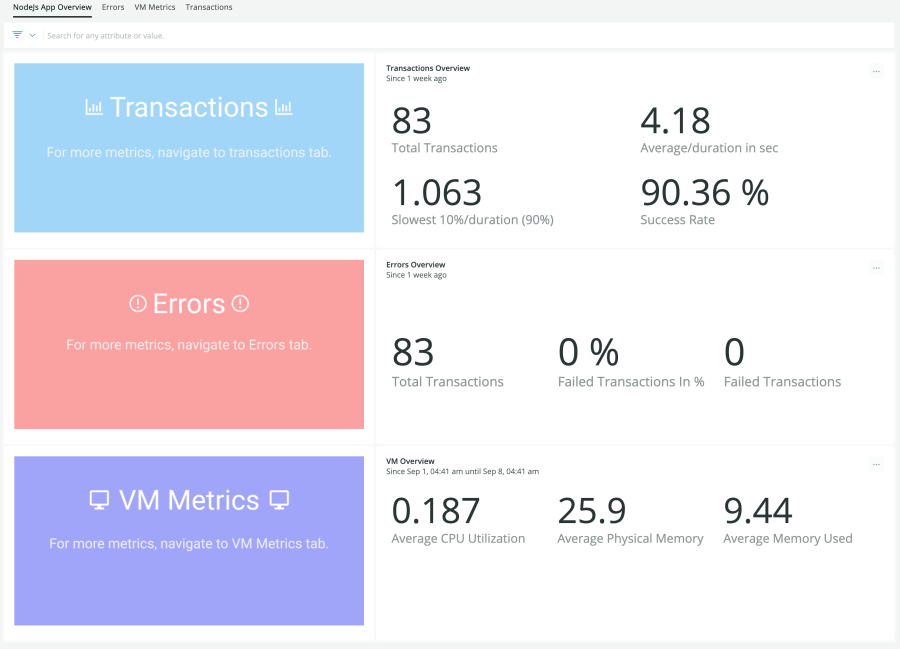
- Multiple ready-to-use dashboards including throughput, error rate %, transaction time in ms, and latest transactions
The Value of New Relic's PHP quickstart
New Relic's instant observability quickstart helps developers leverage broader visibility in a PHP dashboard to resolve errors and speed up processes that enhance customer experiences.