NGINX monitoring quickstart
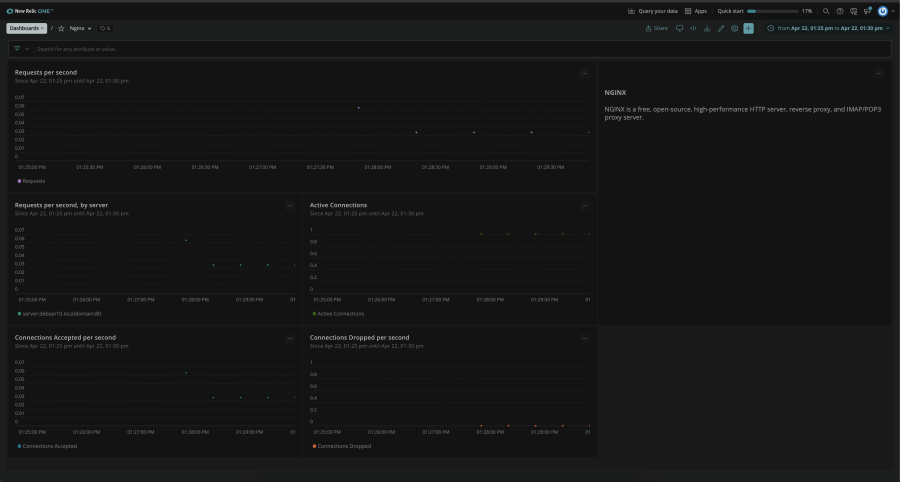
Monitor key NGINX with the New Relic NGINX Performance monitoring integration with metrics like requests per second, connections accepted per second, connections dropped per second, etc. Specifically, our NGINX integration collects and sends inventory and metrics from your NGINX server to the New Relic platform, where you can see valuable insights. From that platform, you can also query data, understand integration data in detail, and create alert conditions.

New Relic Nginx Quickstart Features
- Dashboards: NGINX dashboards proactively monitor NGINX metrics like requests per second, active connections, connections accepted per second, connections dropped per second, etc.
- Automatic On-host integrations instrumentation
- Compatible with both NGINX Open Source and NGINX Plus
Why monitoring NGINX is so important
NGINX is one of the fastest‑growing open-source web servers in the world. However, in some cases, NGINX may not serve requests as quickly as expected due to problems in an application or architecture. Monitoring NGINX performance is essential to ensure that your web application and server environment are healthy. The key to effective NGINX monitoring is the New Relic NGINX quickstart.

New Relic + NGINX - your ideal tool for better monitoring
Download the New Relic NGINX quickstart today to improve NGINX response time, execute NGINX performance tuning, and monitor NGINX traffic efficiently! It is the key to a healthy NGINX server that provides a seamless user experience for web applications.