
MySQL monitoring quickstart
Applications powered by relational database management systems demand the user to understand how the application uses it. Quickly identify and resolve the source server issues with MySQL performance monitoring tools.
Identify query optimization metrics and more within a single New Relic MySQL dashboard and ensure the highest application performance with this approach.

What’s included?
The MySQL quickstart include out-of-the-box dashboards and alerts, including:
- Alerts (pending reads and writes, max connection errors/second, questions/second, and slow queries/second)
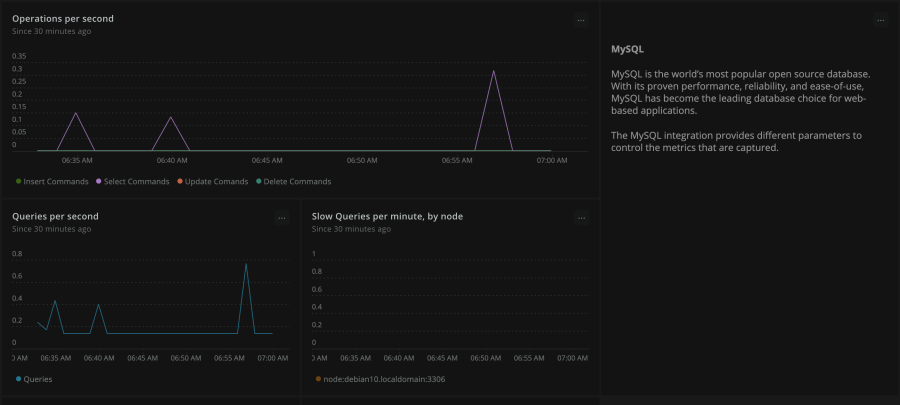
- Dashboards (operations/second, slow queries per minute by node, active connections by node, and more)
The Value of New Relic's MySQL quickstart
New Relic’s instant observability quickstart helps developers accelerate time to value. You can use this approach to help reduce administrative overheads. Implement this robust performance and infrastructure monitoring tool within minutes.

New Relic + MySQL - your ideal tool for better monitoring
Install this quickstart to access preconfigured observability solutions. Unlike other performance monitoring tools, New Relic is a powerful proactive remote monitoring solution that provides a comprehensive view from a single MySQL dashboard.