Quickstart
Speedscale lets you capture traffic from one environment and replay elsewhere. Use the traffic replay to validate new code performance and functionality. Track the SRE golden signals of latency, throughput, CPU, memory and error metrics before you deploy. Preview your container or API behavior in your CI pipeline without having to write any scripts. Any necessary backends are provided by Speedscale’s mocking technology, which also uses past traffic to generate proper responses you expect during traffic replay.
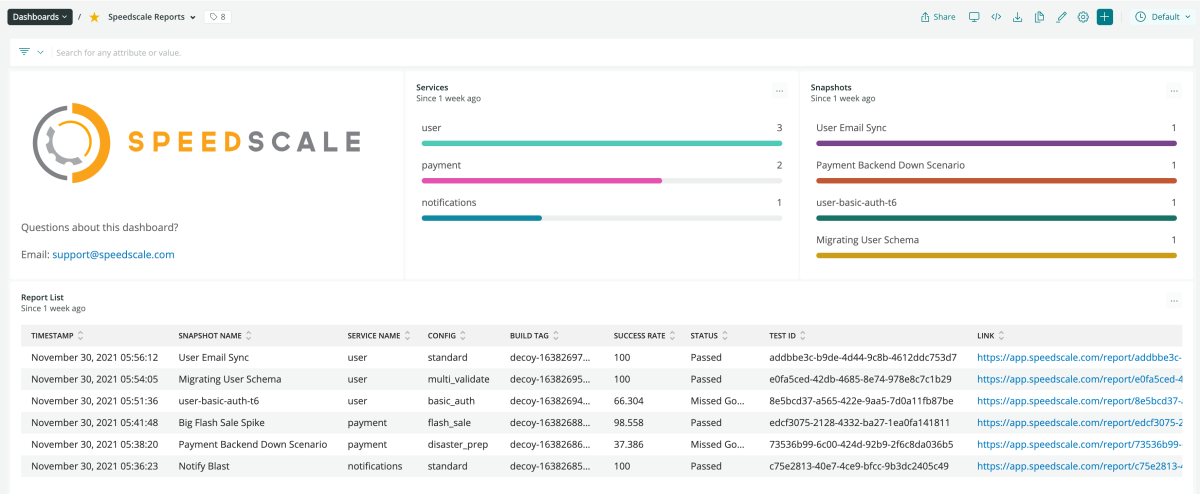
Speedscale Snapshots are subsets of traffic that you would like to replay to test how your new code reacts, similar to test scenarios. Deploying this quickstart adds a Speedscale dashboard to your New Relic account that includes replay success rates, response time and deep links to reports.
Read the integration tutorial for the Speedscale quickstart on New Relic Explorer Hub.
If you have questions about this quickstart please contact support@speedscale.com.
Need help? Visit our Support Center or check out our community forum, the Explorers Hub.

