Quickstart
Comprehensive monitoring quickstart for Redpanda
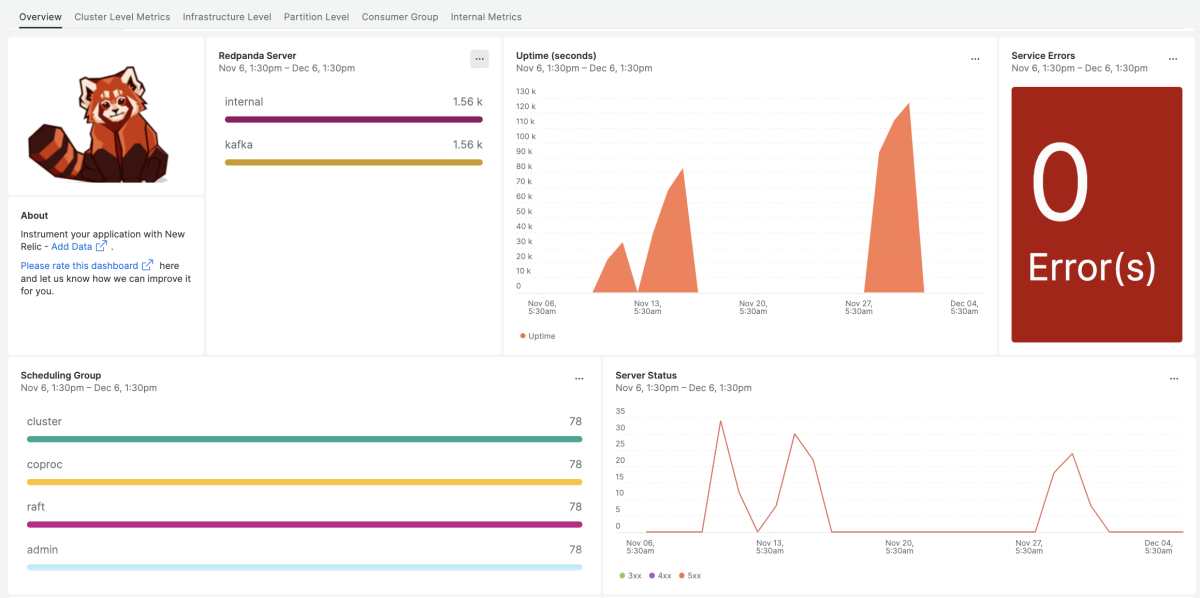
Unleash the power of optimized performance with New Relic’s Redpanda dashboard. Keep an eye on Redpanda metrics, effortlessly monitor your system's health, including uptime and CPU utilization, and stay ahead of any potential issues with real-time tracking of RPC errors, disk storage, and free memory, all at the infrastructure level..
Why monitor Redpanda?
Detect issues early, so you can quickly resolve them and prevent downtime. This is particularly important in a distributed system like Redpanda, where failures in one node can affect the entire cluster.
Scalability alerts
Our high volume request dashboard alerts you immediately to any issues in overscaling your platform.
Latency errors
Identify high latency in processing to solve for overall platform performance.
Data loss
Our quickstart dashboard alerts you immediately in case of failures, to prevent data loss by quick intervention.
Redpanda observability is essential for ensuring its reliability, availability, and performance, and for preventing and resolving issues.
What’s included in this quickstart?
New Relic's Redpanda monitoring quickstart boasts instant full-stack observability out-of-the-box:
- High value alerts for your Redpanda (RPC errors, usage metrics and JVM).
- Dashboards (uptime, CPU utilization, RPC errors, Disk storage, Free memory and more).
Need help? Visit our Support Center or check out our community forum, the Explorers Hub.


