Image
Quickstart
Why monitor your Keras models during inference?
Once Keras models are trained and deployed, monitoring during the inference phase becomes paramount for various reasons:
Improve performance:
Inference, especially with large models, can be computationally intensive. Monitoring metrics like inference latency, memory usage, and GPU utilization can identify bottlenecks, allowing for necessary optimizations.
Model health:
Over time, the distribution of input data might change, a phenomenon known as data drift. Monitoring allows for the early detection of such scenarios, ensuring the model remains robust and accurate.
Data quality:
As models make predictions on new, unseen data, ensuring the quality and consistency of input data is vital. Monitoring can help detect anomalies or inconsistencies in real-time data that could adversely affect model output.
Comprehensive monitoring for Keras models during inference
Properly monitoring your Keras models during the inference phase ensures optimal performance and sustained accuracy. Tracking key metrics will help maintain model health and swiftly detect potential issues.
What’s included in the Keras monitoring quickstart?
The New Relic Keras monitoring quickstart offers specialized out-of-the-box reporting for inference:
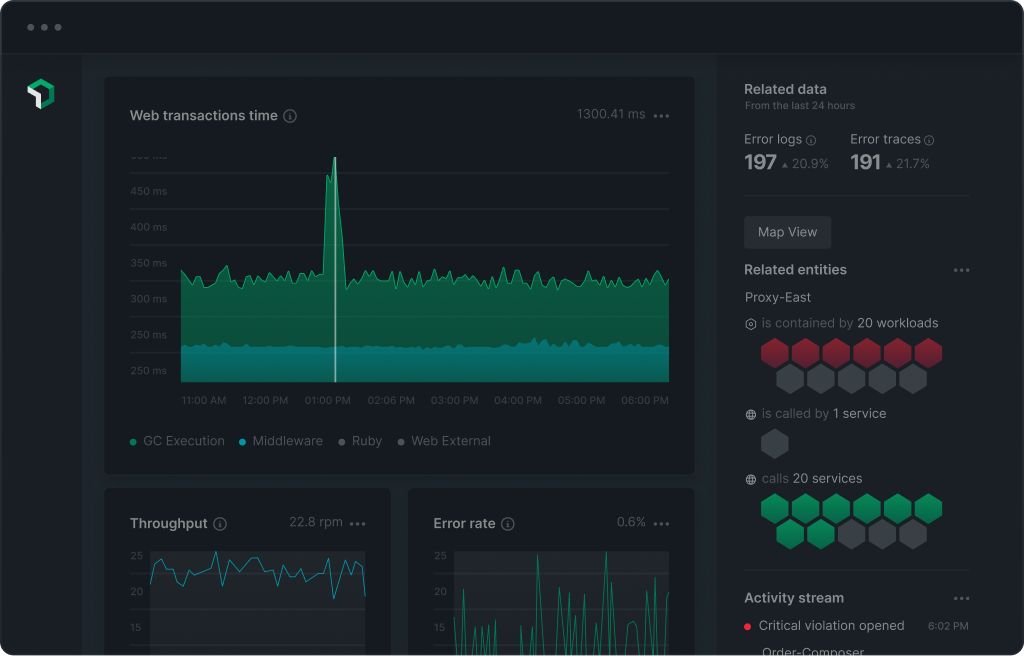
- Real-time visibility: Gain insights into the performance of your Keras models, tracking metrics like inference latency and throughput in real-time.
- Data Integrity Checks: Ensure that the input data for inference aligns with expected formats and does not have any anomalies that could affect model outputs.
- Proactive alerts: Receive immediate notifications about critical issues affecting your Keras model's performance or reliability during inference.
- Resource Utilization: Monitor the computational resources (CPU, GPU, memory) being used during the inference process to optimize deployments and control costs.
Authors
Support
BUILT BY NEW RELIC
Need help? Visit our Support Center or check out our community forum, the Explorers Hub.
Need help? Visit our Support Center or check out our community forum, the Explorers Hub.