Quickstart
AIOHTTP complete monitoring quickstart
Instantly monitor Python applications with AIOHTTP quickstart. Our Python integration lets you quickly identify and resolve potential performance issues with your AIOHTTP server and enhance user experiences.
Monitoring AIOHTTP
Python application developers can extend AIOHTTP performance monitoring to collect, clean, and analyze data to make better data-driven business decisions. Monitoring is vital to ensure uptime and data reliability by keeping an eye on the AIOHTTP server and AIOHTTP client.
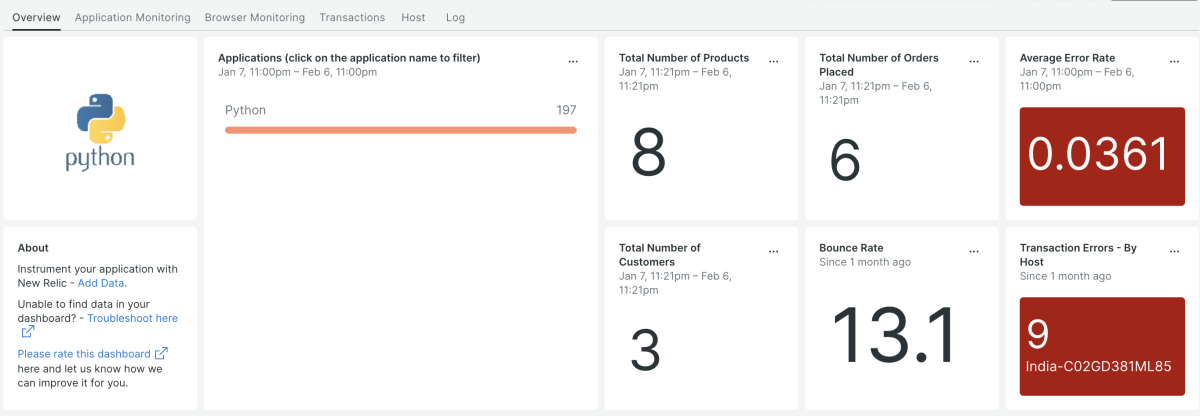
New Relic's AIOHTTP quickstart provides dashboards and built-in instrumentation to track AIOHTTP requests, CPU utilization, garbage collection CPU time, memory heap used, most popular transactions, throughput reports, top 5 slowest transactions, and more.
Count on real-time alerts to apdex scores, CPU utilization, and transaction errors. Expand the Python agent's default monitoring and behavior through the agent API or agent config file and target additional activity and functional calls.
New Relic - The complete AIOHTTP dashboard tool
The AIOHTTP dashboard tool ensures total visibility into critical metrics, leveraging dashboards and synthetic checks. With APIs and flexible custom instrumentation options, developers can use multiple building blocks to improve performance and adapt data for your app.
What's included?
- Dashboards - CPU Utilization, memory heap used, garbage collection CPU time, top 5 slowest transactions, throughput reports, most popular transactions, and more.
- Alerts - apdex score, cpu utilization, transaction error.
Know what's happening in real-time by tracking CPU utilization, throughput reports, and popular transactions with full-stack observability of your entire infrastructure.
With the AIOHTTP complete monitoring quickstart, you can remediate errors before they impact user experience.
Need help? Visit our Support Center or check out our community forum, the Explorers Hub.

