During the last several months, the New Relic team has been working to develop a world-class log management solution for the New Relic One observability platform. Today, we’re thrilled to share, for the first time, the results of that effort: a pair of releases dedicated to solving our customers' biggest log management challenges, as well as setting the stage for even bigger achievements to come.
- First, New Relic has announced the first general availability (GA) release of New Relic Logs, our log aggregation and management tool for New Relic One. New Relic Logs gives our customers a scalable, cost-effective, entirely cloud-based log management tool that greatly reduces the complexity, usability, and implementation challenges associated with many log management solutions.
- We also opened public beta testing for the next major iteration of New Relic Logs. This release focuses on what we refer to as “logs in context”: capabilities that enable customers to identify meaningful trends in their log data, and to correlate log data to other sources of performance data and events—a game-changing advantage for teams that often struggle to maximize the value of their log data.
New Relic One—which now includes access to the GA release of New Relic Logs—is available today to all New Relic customers with a Pro subscription or to those engaged in a free trial. The New Relic logs in context beta release is accessible as an optional update via the Java and Golang language agents in New Relic APM. For detailed information on configuring and using New Relic Logs, customers can consult our product documentation.
Let’s look at what to expect when you try New Relic Logs—and why the time is right to add this functionality alongside the many other innovations happening around the New Relic One platform.

Logs and modern software development: New challenges for familiar tools
Log data is a valuable, and often irreplaceable, source of troubleshooting data for software developers. Today, however, developers are being swamped with more log data, from more sources, than ever before. And as the volume of log data continues to scale, so do the challenges associated with collecting, managing, and analyzing this data.
Consider one example: the abundance of log data associated with distributed, microservices-based applications. These applications routinely use dozens or even hundreds of microservice components written using multiple programming languages—each of which may employ a unique logging framework. Infrastructure logs from firewalls, syslog, servers, databases, load balancers, and other elements are also useful for understanding what is happening within a modern application, yet each of these sources adds time and complexity to a team’s troubleshooting process.
Log management pain points: Lessons learned from New Relic customers
To learn more about the challenges of managing and working with log data, we turned to the best available source: our customers. These conversations surfaced four areas where developers appear to be increasingly frustrated with their current log management solutions:
- Steep learning curves. Developers are dissatisfied with the time and effort required to master best-of-breed logging solutions, many of which employ interfaces that look nothing like other commonly used tools. Even when developers learn the bare minimum required to use a logging tool, a steep learning curve discourages experimentation and reduces the number of team members who can contribute to the incident resolution process.
- Provisioning and management burdens. Many of our customers implement open source logging solutions such as Logstash, Fluentd, and Fluent Bit. These tools typically offer a smooth, out-of-box experience for basic tasks with default configurations, but it can be a different story optimizing them to operate at scale or for complex use cases. The process of provisioning, building, and configuring an Elasticsearch cluster, for instance, can involve extensive trial and error, even though the “error” in this case can impact a team’s ability to troubleshoot production applications.
- Performance frustrations. Even when logging tools are properly configured and optimized, their performance can disappoint—especially as workloads continue to scale. In some cases, for instance, a single query run using ElasticSearch—one component of the “ELK Stack” in use today by 7 out of every 10 New Relic customers—can take several minutes to complete.
- Too many tools, and too little integration. The growing complexity and diversity of log data sources, visualization tools, log management solutions, and related tools leads to a process where developers shift focus constantly between systems, screens, data visualizations, user interfaces, and other variables. As the volume and variety of log data keeps growing, this reliance on a “swivel-chair interface” will become an even bigger source of frustration and inefficiency. Plus, while data from other sources, including application performance and events data, can yield important insights when correlated with log data, this disjointed user experience makes such correlations very difficult to leverage as a troubleshooting resource.
New Relic Logs: A focus on fixing common log management pain points
New Relic Logs gives developers the best of both worlds: log management that is fast, reliable, and highly scalable, while also giving developers simpler, more intuitive tools for troubleshooting and understanding software environments.
- A quick trip along the learning curve. New Relic Logs offers a user experience that requires very little time to discover and master, giving developers more time to focus on troubleshooting and optimizing their applications. In addition, New Relic Logs takes advantage of a “drop-in” implementation process that leverages a team’s existing open-source log filters and other components, while minimizing disruptions for users.
- Faster—much faster—queries. New Relic Logs supports powerful and sophisticated queries of logging data, using either New Relic Query Language (NRQL) or Lucene query syntax. In addition, New Relic’s approach to storing log data eliminates the need for indexing—a step that can cut response times on queries from minutes to milliseconds.
- A cure for indexing headaches. Log data indexing can be a frustrating, resource-intensive, and error-prone chore—and that’s when it goes well. It’s fair to say the best way to “succeed” at indexing logging data is to avoid the task completely, which is exactly what New Relic Logs does for its users.
- Born in the cloud and architected to scale. NRDB, the database that powers the New Relic One platform, connects teams with a horizontally scalable, highly reliable, cloud native architecture. Developers can work with confidence that their logging tools will scale to handle even the biggest and most complex workloads.
- Tools for staying fresh, focused, and efficient. New Relic Logs helps teams stay focused and on-task with capabilities including:
- Data aggregation: Move log data from multiple sources and formats into a single, cloud-based repository.
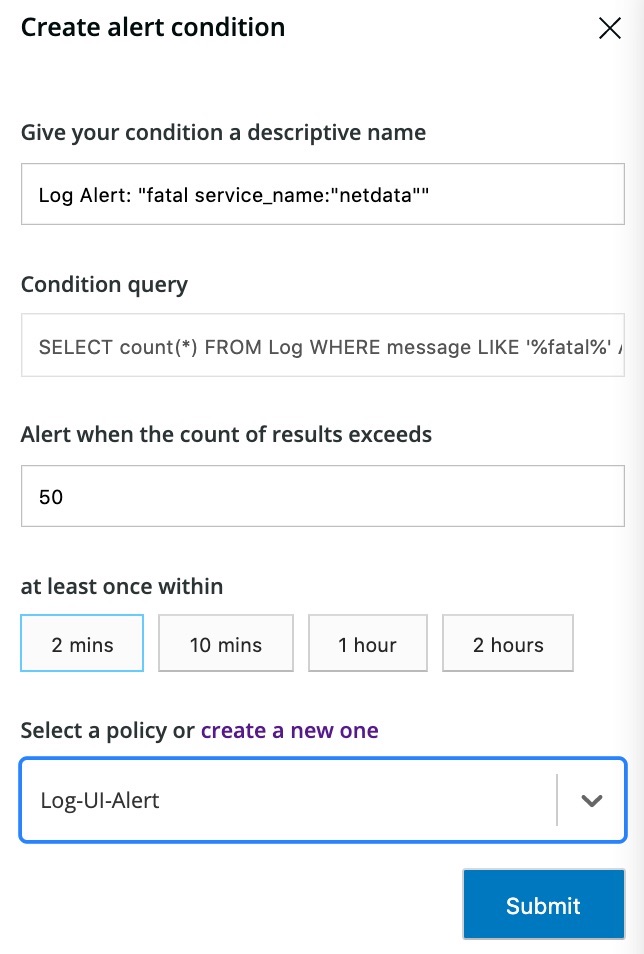
- Use saved searches for fast access to frequently used queries or to trigger alerts and set thresholds.
- A unified, “single pane of glass” view of performance events and logs.
- Implement and manage alerts in one place to get notifications for all event and performance data.
- Dashboards and data visualizations that bring logging insights to life. New Relic Logs leverages the New Relic One platform’s dashboard and data visualization tools to unlock insights that might otherwise remain buried in large sets of logging data:
- View log data in Insights, using existing search queries.
- Use familiar NRQL queries to visualize log data on easy-to-understand dashboards.
- Configure application-specific search queries using non-standard log message attributes.
- Plot log query results on an interactive timeline, and highlight sections to get detailed insights within a specific time period.
- Leverage existing open-source and cloud logging solutions. New Relic Logs reflects the same commitment to openness and interoperability as the New Relic One platform, including:
-
- Plugin support for major open-source log shippers, including Logstash, FluentD, and Fluent Bit for easy onboarding and deployment with New Relic Logs.
- Plugins available for cloud-logging solutions, including AWS Cloudwatch.
Logs in context: Make the connections that matter to you
As excited as we are about New Relic Logs today, we’re even more thrilled about what our customers can experience, beginning today, with our public beta of New Relic’s “logs in context.”
With logs in context, New Relic Logs focuses on bringing context, curation, and intelligence into the logging conversation—leveraging New Relic application and infrastructure metrics, dashboards and data visualizations, event correlations, and other resources to paint a truly complete and integrated picture of a customer’s application environment. This includes:
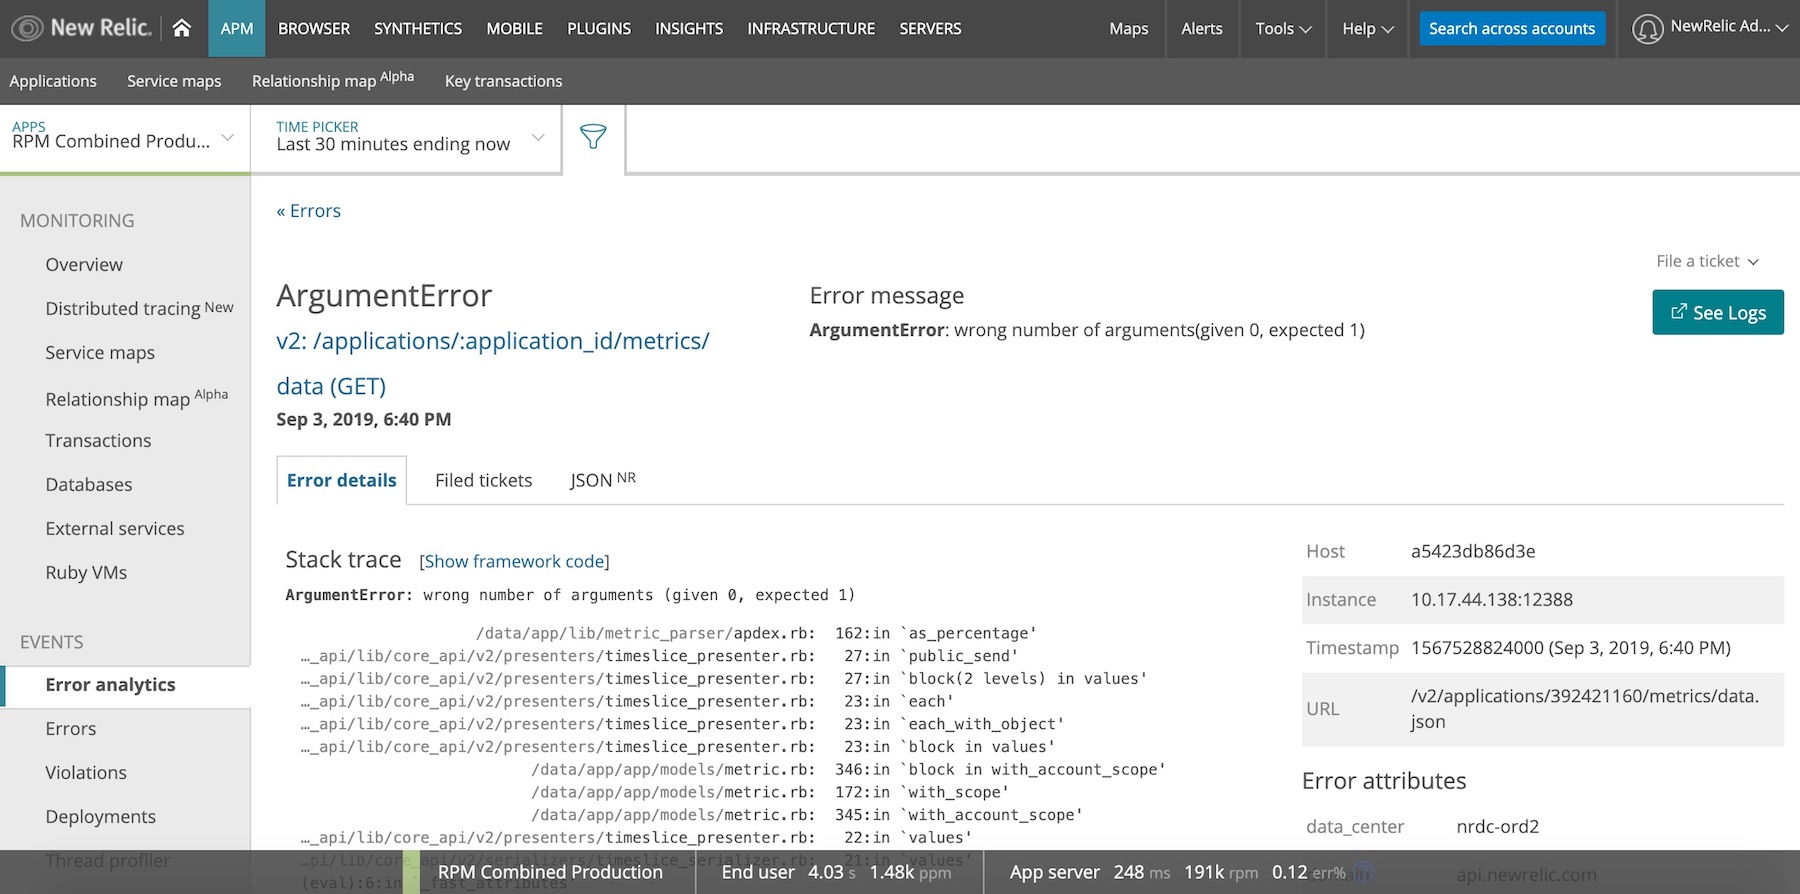
- Moving contextual data into the logging experience. Logs in context automatically connects with data flowing from other New Relic One components. This includes data from New Relic APM and New Relic Infrastructure, in addition to Kubernetes cluster explorer and Lambda (serverless) telemetry.
- Correlating data to reveal meaningful patterns and trends. Logs in context then correlates log messages with application, infrastructure, Kubernetes, and Lambda errors and events data—giving teams end-to-end visibility, as well as a level of depth and detail that simply isn't available when teams work with siloed sources of log data.
- Bringing contextual attributes into logging data. Logs in context also enriches log data with high-value, contextual attributes from applications, serverless, and Kubernetes clusters. The ability to append identifiers such as a pod ID, Service Name, or Application name to logs makes it much easier to analyze this data, make useful connections, and identify other areas where an issue might affect an application's health and performance.
- Programmability in the New Relic platform. As of today, New Relic One is a programmable platform: Users can build React applications on top of New Relic One, with custom data visualizations and interactive interfaces, and with the ability to record and visualize data from any source—including log data. As a result, there's virtually no limit to a team's ability to introduce performance data from almost any accessible source; to combine, correlate, and query these sources with log data; and to visualize and apply this information across the business. Programmability is a defining capability for the New Relic platform; it's unlike anything else available today, and we can't wait to see how our customers put it to work with New Relic Logs.
Logging and observability: Learning to understand modern application environments
New Relic’s mission to pursue a more perfect internet is a driving force behind our work helping software teams find meaning in their data. And it’s why so much of our work focuses on observability: essentially the gathering, visualization, and analysis of metrics, events, traces, and logs in one place in order to gain full insight into a system’s operation.
As one of the pillars of observability, logging has always figured prominently in New Relic’s vision for the future. What has changed, however, is the urgent need to create logging tools that contribute to observability while also keeping developers efficient, focused, and satisfied with their work.
New Relic Logs provides developers with the context they need to understand today’s complex systems. And as part of New Relic One, our logging tools both contribute to and call upon the power and versatility of the first fully programmable observability platform. In the process, New Relic Logs assures our customers that their log data will continue to be a valuable asset and a useful source of performance insights.

The views expressed on this blog are those of the author and do not necessarily reflect the views of New Relic. Any solutions offered by the author are environment-specific and not part of the commercial solutions or support offered by New Relic. Please join us exclusively at the Explorers Hub (support.newrelic.com) for questions and support related to this blog post. This blog may contain links to content on third-party sites. By providing such links, New Relic does not adopt, guarantee, approve or endorse the information, views or products available on such sites.


