New Relic Insights is the place you go to ask questions of your data and find answers. Insights is designed to make it easy to ask questions, but drilling down to find the precise information you’re looking for can sometimes require multiple iterations. You may write a query, look at the results, change the query, and run it again until you reach the data you need to fully answer your question. Or you might prefer to build a New Relic dashboard made up of multiple queries to see how your data looks side by side. Other times, you may not know what information is interesting or important until you try several other initial queries.
No matter how you get there, the key to finding useful answers is being able to identify the important patterns and trends. To help you do that, New Relic is proud to announce multi-attribute FACETs as a new New Relic Query Language (NRQL) capability in New Relic Insights. The ability to add multiple FACETs increases the power of NRQL and allows customers to group data together in new ways.
Write more robust NRQL queries
With multi-attribute FACETs, what used to require multiple queries can now be consolidated into a single query, making it easier to mix and match attributes that may be correlated.
Users will now be able to add up to five FACETs in a single query and see the results together in the same widget. (For example, the code snippet below includes three FACETs: pageUrl,
userAgentName, and userAgentVersion.)
Importantly, multiple FACETs are not restricted to simple attributes, but can be used with anything that you can already facet on, including CASES. The code snippet below includes apm_product and mobile-product:

Using more FACETs in a query gives New Relic customers much more fine-grained control over their data analysis.
Come to conclusions more quickly
Multi-attribute FACETs can be used to do almost anything, from exploring the data by mixing and matching to see what surfaces, to drilling down on various combinations of data to see the results of a mission-critical query.
Prior to this feature, a user might have to run different query permutations in order to understand the data set. They might run this query:
SELECT average(pageRenderingDuration) FROM PageView where userAgentName = 'Chrome' facet pageUrl since 60 minutes ago limit 10
And then run a second query swapping “Chrome” to “Firefox,” do a WHERE clause to narrow down the pageURL, or other functions to reduce the data set.
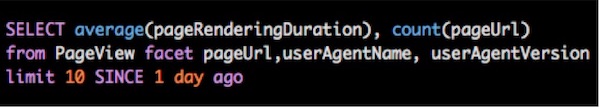
With multi-attribute FACETs, users don’t need to refine the query as much to get meaningful results. Now they can get a more complete look of the data set by applying multiple FACETs, like this:
SELECT average(pageRenderingDuration) FROM PageView facet userAgentName, userAgentVersion, pageUrl since 60 minutes ago limit 10
Below is an example of three different charts for the same query, showing the average time it takes to render a page. Additionally, you can view the data in groupings to see it by PageURL, userAgentName, and userAgentVersion:
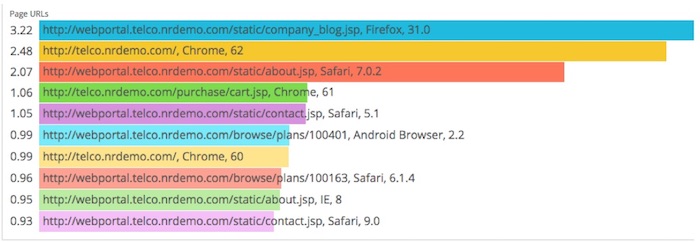

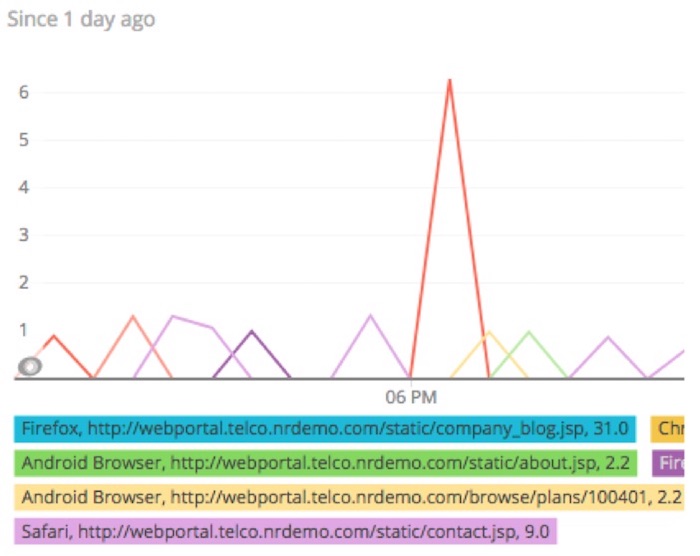
Seeing data FACETs together on the same chart can help close gaps that may have formed when running query after query in an attempt to understand the full data set.
To learn more about how to apply multi-attribute FACETs, check out the New Relic Insights documentation.

The views expressed on this blog are those of the author and do not necessarily reflect the views of New Relic. Any solutions offered by the author are environment-specific and not part of the commercial solutions or support offered by New Relic. Please join us exclusively at the Explorers Hub (support.newrelic.com) for questions and support related to this blog post. This blog may contain links to content on third-party sites. By providing such links, New Relic does not adopt, guarantee, approve or endorse the information, views or products available on such sites.


