On a recent Friday afternoon, “Bill” walked into “Peter’s” office. Bill looked concerned.
“For the past several days,” Bill said, “I’ve been hearing reports that our application is running much more slowly than usual, and with many more errors. I know your team released a new version last week; do you think it could be the problem?”
“It works on my machine,” answered Peter, “and it looked fine in QA. It must be something else. Have you checked with IT?”
“Yes,” said Bill. “They say nothing has changed on their end. We need to figure this out ASAP; you’d better tell your team to plan on working this weekend.”
“Frack!” thought Peter. “I need some way to quickly show Bill that this isn’t our fault. And if it is our fault, I’d like to know for sure so we can roll back to the previous version and not have to spend the weekend in the office! I wonder if New Relic APM can show me how the app performed before and after last week’s release?”
New Relic APM can help out here (do you think we would bring it up, otherwise?), using a feature called Deployment Tracking.
What is Deployment Tracking?
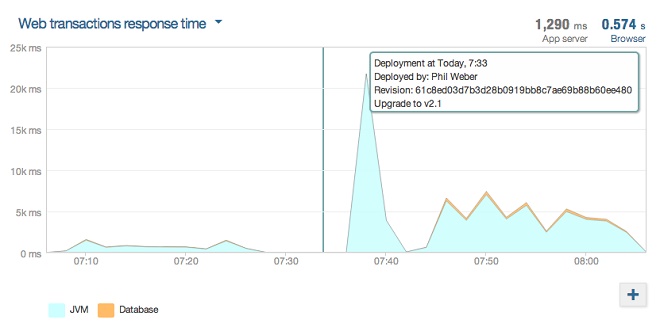
Deployment Tracking lets you quickly see how code deployments affect your application’s performance. If you notify New Relic when you deploy new code, a blue vertical bar will appear on your charts, indicating when the deployment occurred. If you hover your cursor over the vertical bar, it displays information about the deployment:

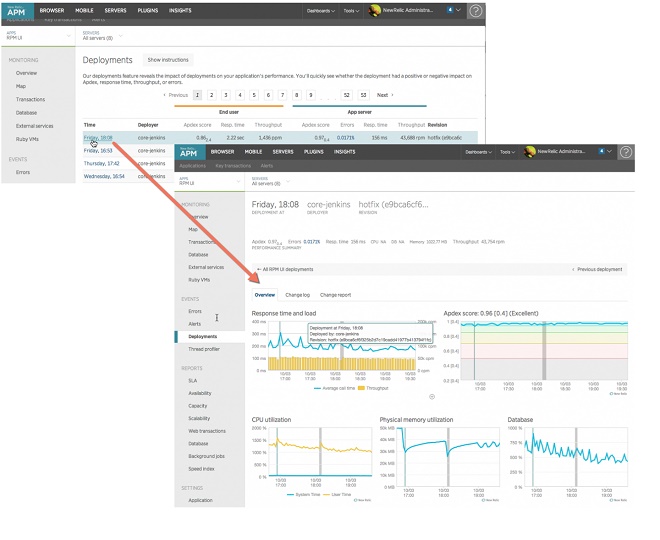
You may visit the Deployments dashboard by selecting Events > Deployments while viewing your application in New Relic:

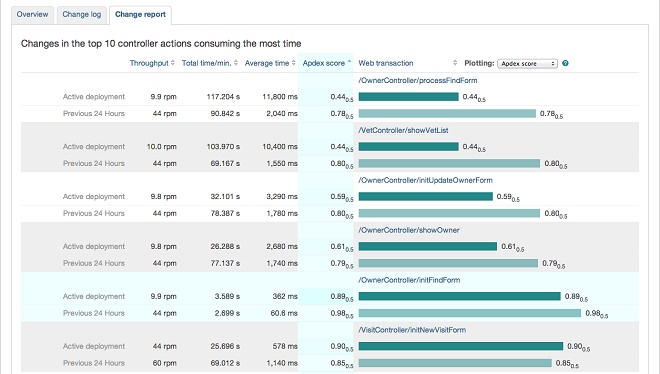
The Change report shows you at a glance how a deployment has impacted your application’s performance:

Looks like this deployment definitely has some problems: Apdex scores and throughput are significantly lower after the deployment than they were the day before. Time for a patch or a rollback!
Setting up Deployment Tracking
“Great!” you say, “How do I do it?”
New Relic provides several ways to integrate Deployment Tracking into your release process. The Ruby agent includes Capistrano recipes and may be called from the command line. The Java agent also provides a command-line interface that you can execute manually or from a build script. Finally, New Relic provides a REST API that you can use with any language; you can view detailed instructions by clicking the Show instructions link on the Deployments dashboard:
![]()
You’re not limited to using this feature to track only deployments. You can also use it to track architecture and business changes. Imagine that you upgrade the database software on your servers and wanted to know how the upgrade affects your query performance. You may call the New Relic API from the command line to get a marker on your graphs and have access to all of New Relic’s reports to compare performance before and after the change.
Go forth and track!
Deployment Tracking is an easy and useful way to track changes to your system, and to see at a glance how they affect your performance. So get out there and start tracking!
Have you found a creative way to use Deployment Tracking with your application? Have a war story about how Deployment Tracking has saved your weekend? Tell everyone about it in the New Relic Community Forums!
The views expressed on this blog are those of the author and do not necessarily reflect the views of New Relic. Any solutions offered by the author are environment-specific and not part of the commercial solutions or support offered by New Relic. Please join us exclusively at the Explorers Hub (discuss.newrelic.com) for questions and support related to this blog post. This blog may contain links to content on third-party sites. By providing such links, New Relic does not adopt, guarantee, approve or endorse the information, views or products available on such sites.


